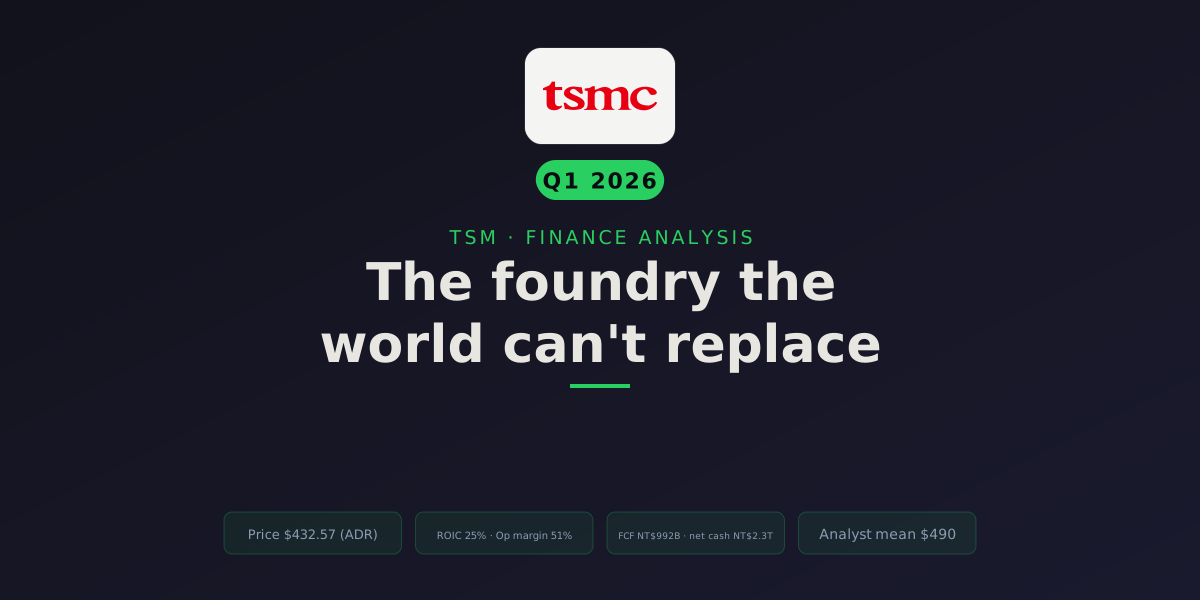
Every AI chip you have heard of, the Nvidia GPU training the models, the Apple silicon in your phone, the AMD processor in a hyperscaler’s server, is designed by one company and built by another. The design names get the headlines. The building happens almost entirely inside one Taiwanese firm that controls north of 90% of the world’s leading-edge chip manufacturing. Taiwan Semiconductor, trading at $432.57 on its US ADR as of July 8, 2026, is the closest thing the technology economy has to a single point of failure. And a single point of leverage.
That combination, indispensable and irreplaceable, is why the ADR is up from a 52-week low of $223.70 to $432.57, nearly doubling. It’s also why the two biggest questions about TSMC have nothing to do with whether it’s a great business. It obviously is. The questions are: what does $432 already assume about the future, and what happens if a Chinese fishing boat sits on the wrong undersea cable?
Here’s how I’ll work through it. Separate the quality of the business from the price. Then value TSMC the way you have to value any company pouring a fortune into building capacity ahead of demand, and be honest about a geopolitical risk that no spreadsheet can price. A note on units, because it matters this time: TSMC reports in New Taiwan dollars (NT$), and I’ll keep all the business figures there, computed from its own statements. The stock quote I’m using is the US ADR in dollars (one ADR represents five ordinary Taipei-listed shares), so per-share valuation numbers below are in US dollars per ADR. Where I convert between the two I use 0.0312 (TWDUSD), the rate as of July 8, 2026.
For every NT$1 of capital TSMC has put to work it earns about 25 cents of after-tax operating profit a year. Against a cost of capital under 10%, that gap is the numerical fingerprint of a moat, and it is rare for a business this capital-heavy.
A contract manufacturer keeping half of every revenue dollar as operating profit should not exist. Most assemblers earn low-single-digit margins. TSMC earns software-like margins because customers have no second source for a leading-edge chip.
TSMC holds NT$3.4T of cash against NT$1.1T of debt. It funds the most expensive factory build on earth from its own cash flow, not leverage, which is why it can keep spending straight through a downturn.
The 18-analyst consensus target for the ADR sits about 13% above the $432.57 price. That is the actionable margin of safety an investor watches, and it is thin: TSMC is priced near fair value, not at a bargain.
A moat you can measure in returns on capital
Return on invested capital is where I start, because it answers the only question that matters about a business: when management reinvests a dollar, do they get back more than a dollar? For TSMC the answer has been a loud yes. ROIC ran 25.9% in FY22, dipped to 18.4% in the 2023 downcycle when smartphone and PC demand cratered, recovered to 20.7% in FY24, and hit 25.2% in FY25. Against a computed cost of capital in the 8 to 10% range (more on why that band is wider than it should be later), that gap is enormous.
What makes it remarkable is where it’s earned. This isn’t an asset-light software company. TSMC spends more on capital equipment than almost any company on earth, an EUV lithography machine from ASML runs into the hundreds of millions of dollars, and it still clears 25% returns. That only happens when you have pricing power, and TSMC has it because there is no second supplier for a 2-nanometer chip. Nvidia cannot take its N2 order to Samsung and get the same result. That’s the moat: not a brand, not a patent, but a technology and yield lead so wide that the customer has nowhere else to go.
The FY23 dip is the tell that this is a cyclical business wearing a compounder’s clothes. Chips are cyclical, TSMC is not immune, and any honest thesis has to hold both ideas at once: the returns are extraordinary across the cycle, but they breathe with it. The move back to 25% in FY25 is the AI cycle pulling demand back up hard.
Margins that shouldn’t exist in manufacturing
Look at what the operating margin does across the cycle. It fell to 42.6% in the FY23 downturn, then climbed back to 45.7% and then 50.8% in FY25. Gross margin sits near 60%. For context, most contract manufacturers earn low-single-digit margins, they’re commodity assemblers. TSMC earns half of every revenue dollar as operating profit while running the most capital-intensive process in the industry. The only way that math works is if customers pay whatever TSMC asks for leading-edge capacity. In 2026 they are lining up to do exactly that.
The recovery has continued into 2026. TSMC reported Q1 2026 gross margin of 66.2%, a record, and operating margin of 58.1% (TrendForce, Jan 15, 2026). Those quarterly figures run above the full-year FY25 numbers below because the AI mix keeps enriching. I’ll anchor the valuation on the audited full-year statements and treat the 2026 quarters as directional confirmation.
The cash is real, and the build is hiding it
Here is the number that reframes everything. In FY25 TSMC produced NT$2,275 billion of operating cash flow (about US$71B) and spent NT$1,283 billion on capital expenditure. What’s left, free cash flow, is NT$992 billion (roughly US$31B). Free cash flow grew just 15% year over year while revenue grew 32% and net income grew 47%. That gap is not weakness. It’s the build.
This is the single most important idea for valuing TSMC, and it’s the same distortion that trips people up on the hyperscalers like Microsoft and Meta. When a company spends a third of its revenue laying down factories that will earn for a decade, today’s free cash flow is suppressed by design. Capex is an investment in future revenue, not a permanent cost. TSMC is mid-build on its 2nm (N2) node, which entered volume production in Q4 2025, and its A16 node, targeted for high-volume manufacturing in the second half of 2026. The cash going into those fabs is what will produce the chips Nvidia and Apple are already queuing for.
A data note, because it matters for the valuation. TSMC’s reported free cash flow of NT$992B is a healthy 26% FCF margin, high for a company spending this heavily. But that margin has swung with the capex cycle: 23% in FY22, down to 13% in the FY23 trough, up to 30% in FY24, and 26% in FY25. The FCF number you value the company on depends entirely on where in the capex cycle you catch it. Catch it in a heavy build year and you understate the steady-state cash machine underneath. I’ll come back to this when the multiples start lying to us.
Put the two side by side, the profitability the business earns and the cash it actually keeps, and the distinction jumps out.
The bill capex sends later: depreciation
There’s a second-order cost the bull case tends to skip. Capex isn’t only a cash outflow today. Every fab and every tool TSMC buys becomes depreciation on the income statement for years afterward, and depreciation is a real expense that eats the operating margin the bull case is celebrating. So the record NT$1,283B FY25 build (US$52–56B guided for 2026, up from roughly US$41B spent in 2025) is a promise of higher depreciation to come, not just a cash-flow story.
How big is it? Backing depreciation and amortization out of the statements (EBITDA minus operating income), D&A ran about NT$801B in FY25, roughly 21% of sales, down from 26% in FY24 and 28% in FY23. The reason it fell as a share of revenue is instructive: FY25 revenue grew 32% and outran the depreciation base. That’s the good outcome, and it’s exactly why the operating margin hit a record 50.8%. The question is whether it holds. As two years of record capex (2025 and 2026) convert into depreciation with the usual lag, D&A almost certainly reclimbs toward the mid-20s percent of sales over 2026–28. If revenue keeps compounding at 30%, the margin absorbs it and FY25 is not a peak. If AI demand cools even a little while the depreciation from those fabs lands anyway, then 50%+ operating margins were a pre-depreciation-wave high, and the margin gives some back.
Here’s the defense, and it’s a real one: TSMC is far less exposed to this than the GPU buyers filling its order book. A fab and its lithography tools depreciate over ten to twenty years; the Nvidia GPUs inside a hyperscaler’s data center are written down over three to five. TSMC’s asset base earns for a long time, which stretches the depreciation over a wide base and keeps the annual hit manageable. The depreciation wave is a headwind to watch, not a thesis-breaker, but anyone modeling 50%+ margins forever is modeling the pre-wave peak, not the average.
A balance sheet that could survive an earthquake
For a company this capital-hungry, the balance sheet is not a footnote, it’s a load-bearing wall. TSMC carries NT$3,384 billion of cash against NT$1,094 billion of total debt, leaving NT$2,289 billion of net cash (about US$71B). Net-debt/EBITDA is −0.80x, meaning it could retire all its debt tomorrow and still have a mountain of cash left. Interest coverage runs 156x. The current ratio is 2.5.
Why does this matter beyond looking tidy? Because it means TSMC funds its record capex from its own cash flow and reserves, not from leverage. The N2 and A16 build is self-financed. That’s the difference between a cyclical that gets crushed when the cycle turns, forced to cut capex at the worst moment, and one that can keep investing straight through a downturn and come out the other side further ahead. In 2023, when revenue actually fell 4.5%, TSMC kept spending. That’s a luxury only a fortress balance sheet buys. It also has a direct bearing on the discount rate, and I’ll flag why below: a business with almost no net debt should be valued mostly on its cost of equity, not on a blended rate that leans on cheap debt it barely uses.
On a screen for the classic warning signs, declining sales, margin compression, negative cash flow, sub-10% returns, excessive leverage, TSMC trips essentially none. There’s one year of sales decline (the FY23 cyclical dip) and one of margin compression (same year), no negative-FCF years, no poor-ROIC years, no leverage flag. Stock-based comp is a rounding error at 0.03% of sales. A clean tearsheet.
Where the money goes: build first, then a growing dividend
How a company spends its cash tells you how management thinks. TSMC’s answer is unambiguous: build, then pay a rising dividend. Measured against cumulative free cash flow over five years, capex ran 161% (it spends more on factories than its post-capex free cash flow, funding the gap from operating cash flow and reserves), dividends ran 53%, and buybacks and acquisitions together were under 1%. There is no financial engineering here. Management under chairman and CEO C.C. Wei is doing two things with the cash: extending the process lead that is the entire moat, and paying out a dividend that has compounded steadily.
The dividend deserves its own look, because it’s a real part of the total-return story and it doubles as a valuation signal. TSMC’s ADR paid roughly $3.12 per share in 2025, up from $2.34 in 2024, and the payout ratio is a conservative ~28% of earnings, so the dividend is comfortably covered even while the company floods cash into fabs. The forward yield on the ADR is only about 0.84% at today’s price (Yahoo Finance, Jul 8, 2026), and here’s the useful part: that’s well below TSMC’s own five-year average yield of about 1.56%. When a stock’s yield sits below its own history, it usually means the price has run ahead of the payout, which is another way of saying the stock isn’t cheap on a dividend basis. The dividend per share has grown at roughly a 13% five-year CAGR and a 16% ten-year CAGR, and TSMC has raised or held it every year I can find, though I’d point you to TSMC’s own investor relations for the exact streak rather than trust an aggregator’s count.
Is that good capital allocation? For a business earning 25% on incremental capital, spending everything you can on more of it is exactly right, as long as the returns hold. The risk isn’t the strategy. It’s the price of the equipment (EUV and now High-NA tools keep getting more expensive) and the possibility that the AI demand it’s building for softens before the fabs are paid off. Which brings us to the price.
Now the part everyone argues about: the price
Before any of the arithmetic, one honest disclosure about the discount rate, because it drives everything below. My data tooling this run derived a weighted-average cost of capital of 7.3%, built from a beta of 1.25 but a debt weight of about a third. That debt weight is too high for a company with negative net debt, so the blended rate leans on cheap debt TSMC barely uses and comes out artificially low. A cleaner rate for a near-debt-free business is its cost of equity, which the same CAPM inputs put near 9.9% (last quarter’s run landed at 9.75% on a fuller equity weight). I think the truth is closer to that ~9.75% equity-driven number, so that’s my base case, but I’ll show you what happens at both, because the choice of discount rate turns out to matter as much as the growth rate.
Now, where I always start on a hard valuation: not “what’s it worth?” (unknowable) but “what does today’s price already assume?” Run the cash flows backward from the $432.57 ADR and it depends heavily on that discount rate. At the aggressive 7.3% WACC, the market is implying only about 17% annual free-cash-flow growth for a decade. At my preferred ~9.75%, the implied hurdle jumps to roughly 24%. So the honest reverse-DCF read is a range: the price bakes in somewhere between 17% and 24% FCF growth for ten years, depending on how much credit you give the balance sheet, call it a ~21% midpoint (which is the single figure on the valuation card below). Everything downstream keys off that range, not a false-precision point.
Treat that as a hurdle to clear, not a fair value. Can TSMC grow free cash flow ~17–24% a year for ten years? Here’s the honest read. Revenue grew 32% in FY25, and for full-year 2026 management expects roughly 30% growth in US-dollar terms and has said it is capacity constrained, i.e. the ceiling right now is how fast it can build, not how much customers want (Electronics Weekly, Jun 10, 2026). AI accelerator revenue is guided to compound in the mid-to-high-50s percent. On revenue, the low end of that hurdle is very achievable near-term. On free cash flow, the bar is trickier, because 2026 is another record-capex year, US$52–56 billion guided on the January 2026 call, up from US$40.9B actually spent in 2025 and US$29.8B in 2024 (TrendForce, Jan 15, 2026). That capex suppresses near-term FCF. So the FCF hurdle is really a bet that the capex cycle eventually plateaus and cash conversion catches up to the growth. Given the AI backdrop and TSMC’s monopoly on leading-edge, the lower end is undemanding and the upper end (24%) asks the AI supercycle to persist through a decade.
One reason to trust the guide: management has been beating it, not massaging it. On the January 2026 call TSMC guided Q1 2026 revenue to US$34.6–35.8 billion with gross margin of 63–65% and operating margin of 54–56%. It then delivered US$35.90 billion, a 66.2% gross margin and a 58.1% operating margin, clearing the top of every band (TrendForce, Jan 15, 2026). A management team that beats its own margin guidance by two-plus points is one whose forward numbers deserve less of a haircut, not more. (Its next report, on July 16, 2026, is where I’ll score the Q2 guide of US$39.0–40.2 billion.)
Now the multiples, which need context or they mislead. And one of them this run is simply broken, so I’ll say so plainly.
A currency caveat you should know about, because it’s exactly the trap the brief warned me to catch. The raw data feed this run reported an EV/FCF of negative 0.05x, an obviously impossible number. It’s an artifact of mixing a US-dollar market cap with New-Taiwan-dollar cash flows: the enterprise value came out nonsensically negative when a TWD net-cash figure was subtracted from a dollar-denominated market cap. I’ve disregarded that broken figure entirely. Computed on a single, consistent currency, TSMC’s EV/FCF is roughly 62x trailing and ~35x forward, the numbers in the chart above, and those are the ones to reason from.
Look at that EV/FCF bar: over 60x trailing. On its face, absurd for anything. But that’s the trough-FCF trap, and it’s the most important thing to understand here. The multiple is high because the denominator is depressed by the record capex build. Valuing TSMC on 60x today’s suppressed free cash flow is like valuing a homebuilder on the year it bought all its land, you’re capitalizing the investment year as the steady state. Set it aside as an artificial ceiling on the multiple (and floor on fair value), not the pessimistic-but-fair case.
The forward figures tell the truer story: as the FY26 earnings land, the P/E compresses to ~21x and EV/EBITDA to ~13x. A ~21x forward P/E for a company growing 30%+ with 25% ROIC and a monopoly on the most strategically important product on earth is not, on its face, an expensive stock.
What is it actually worth?
Most valuations quietly cheat: someone picks a growth rate and a discount rate that produce the answer they wanted. I want inputs the financials imply, so both are computed, and I’ve already told you the one place I overrode the tooling (the discount rate).
- Growth (≈ 27%). This is a recency-weighted blend of TSMC’s revenue-growth trend (which ran −4.5% in FY23, then +33.9% and +31.6%) with analyst next-year consensus of ~27.9%. The model caps it at 30% and lands at 27%. That’s aggressive, and it’s the AI supercycle doing the work. It is not a through-the-cycle number, and any buyer should treat it as an upcycle assumption, not a permanent one.
- Discount rate (WACC, base ~9.75%). From CAPM: beta 1.25, a 4.3% risk-free rate, a 4.5% equity risk premium, and, crucially, an equity weight that reflects TSMC’s near-zero net leverage. That gives a cost of equity near 9.9% and a WACC near 9.75%, and I use that as base rather than the tooling’s mechanically-derived 7.3% (which over-weights debt TSMC doesn’t really carry). The rate cuts both ways beyond that, and it’s worth being honest about both directions. On one side, it carries no explicit geopolitical premium; a cautious investor would add several points for Taiwan risk, which pulls fair value down hard. On the other side, some argue a sovereign-grade monopoly that the entire AI economy depends on deserves an “AI-utility” discount, a lower rate, on the logic that its cash flows are as close to non-discretionary as a chipmaker’s get.
Feed 27% growth and a 7.3% WACC (the tooling’s rate) into a DCF on the NT$992B free cash flow, and the base case lands at an eye-watering ~$949 per ADR. Use my preferred ~9.75% equity-weighted rate instead and that number falls dramatically. That single swap, nothing else changed, is the clearest illustration you’ll ever see that a DCF is a lever, not a measurement. Watch what the assumptions do:
| DCF scenario | Fair value / ADR |
|---|---|
| 22% growth, 7.3% WACC (tooling rate, low) | ~$631 |
| 27% growth, 7.3% WACC (tooling rate, base) | ~$949 |
| 32% growth, 7.3% WACC (tooling rate, high) | ~$1,411 |
| 22% growth, ~9.75% WACC (my rate, low) | ~$374 |
| 27% growth, ~9.75% WACC (my rate, base) | ~$538 |
| 32% growth, ~9.75% WACC (my rate, high) | ~$766 |
Look at the two blocks side by side, because that’s the point. Hold growth at 27% and just swap the tooling’s 7.3% for my preferred ~9.75% equity-weighted rate, and the base case falls from $949 to **$538 per ADR**, a 43% haircut from one input I changed on principle, nothing else touched. That single swap is the clearest illustration you’ll ever see that a DCF is a lever, not a measurement. Then a few points of annual growth swings each column by hundreds of dollars per ADR on top of that: at my 9.75% rate the range runs ~$374 to $766 across a plausible 22–32% growth band. Anyone quoting you “TSMC is worth $949” as fact is selling false precision built on a 7.3% discount rate I don’t even believe. The honest takeaway: the DCF ceiling (high growth, low discount rate) is well above the price, my equity-weighted base ($538) sits below it, and the market’s $432 price falls between my low and base cases at the ~9.75% rate. Neither column is “the” answer.
So we have methods pointing in different directions: the multiple model on trough FCF spits out an artificially low fair value that I discard, the DCF at the tooling’s rate says ~$631 to $1,411 per ADR, my equity-weighted DCF (the ~9.75% column above) runs ~$374 to ~$766 with a ~$538 base, and 18 analysts sit at a mean target of $490.34 (range $354 to $700), with a Strong Buy consensus. That’s a wide spread on the same company. The truth is in the messy middle.
Reconciling it. Reject the trough-FCF multiple floor, it capitalizes the capex year. Reject the ~$1,411 blue-sky case too, it assumes 32% growth compounding for a decade at a 7.3% discount rate, which stacks two optimistic assumptions no cyclical earns. What’s left is the sensible band: my equity-weighted DCF at 22–27% growth ($374 to $538) brackets the Street’s $490.34 mean, and the analyst range ($354–$700) overlaps it from above. Those two independent methods converging near $490 is the anchor. I land on an intrinsic range of roughly $430 to $560 per ADR, with the market pricing near the low end because the growth is cyclical (it will not stay at 30% forever) and there’s a geopolitical tail risk the DCF can’t capture.
Intrinsic value · the verdict
Blended fair value
$490
Current price
$433
Margin of safety
13%
Reverse-DCF check: at $433 the market is implicitly pricing in roughly 21% annual free-cash-flow growth for the next decade. The question isn't whether the business is great. It's whether it can clear that bar.
Fair values from multiple methods (see above). Source: Yahoo Finance + computed WACC/growth · as of July 2026. Illustrative, assumption-driven, not a price target.
Two margins of safety, because they answer different questions. Against my ~$430–560 intrinsic range, $432.57 sits right at the bottom, essentially no cushion to the midpoint. Against the actionable number an investor actually watches, the $490.34 analyst mean, today’s price is about 13% below. Neither is the fat margin of safety a value investor dreams of. TSMC is not obviously cheap. But it’s also nowhere near the bubble the 60x trailing FCF multiple would scare you into believing.
Which reduces the entire thesis to one sentence, plus an overlay. Does the incremental ROIC on the record N2 and A16 capex clear the cost of capital over the next five years, and does Taiwan stay off the front page? Clear the first and the capex converts to a rising cash machine and $432 looks like a reasonable entry into a monopoly. Fail the second, and none of the arithmetic matters. That second variable is why I won’t pretend the DCF is the whole story.
Tailwinds and headwinds
A DCF is only as good as the demand behind the growth rate, and TSMC’s forward story is unusually well-documented right now.
The clearest read on where the business is going comes from the CFO. On the April 16, 2026 call, Wendell Huang framed the whole quarter, and the one ahead, around a single driver.
Wendell Huang · SVP & Chief Financial Officer, TSMC
Q1 2026 results, April 16, 2026
“Our business in the first quarter was supported by strong demand for our leading-edge process technologies,” said Huang. “Moving into second quarter 2026, we expect our business to be supported by continued strong demand for our leading-edge process technologies.”
That is the entire bull case in two sentences: the demand isn’t a forecast, it’s already booked, and the constraint is capacity, not appetite.
Tailwinds, what carries the growth:
- HPC and AI now drive the business. High-performance computing was 61% of net revenue in Q1 2026, up from 55% the prior quarter and 58% for full-year 2025 (TSMC Q1 2026 management report, Apr 2026). The AI accelerator business is guided to compound in the mid-to-high 50s percent through 2029.
- The near-term guide is accelerating. For Q2 2026 TSMC guided revenue of US$39.0–40.2 billion with gross margin of 65.5–67.5% and operating margin of 56.5–58.5% (TrendForce, Jan 15, 2026). The midpoint implies another leg up on an already record Q1, and margins holding above 65% while the company floods cash into new fabs.
- Management’s demand read is on the record. Chairman and CEO C.C. Wei has described the AI demand cycle as a durable, multi-year trend on TSMC’s recent calls, and the reported figures are consistent with it: leading-edge capacity is contracted ahead of being built.
- Record monthly revenue. May 2026 sales hit NT$417 billion, up 30% year over year, a record (Electronics Weekly, Jun 10, 2026). The demand signal is showing up in the monthly prints, not just the guidance.
- The node lead widens. N2 entered volume production in Q4 2025; A16 with backside power delivery is targeted for high-volume manufacturing in H2 2026. Each node TSMC ships first is a fresh window where it is the only supplier.
Headwinds, what breaks the thesis:
- Taiwan. Full stop. This is the risk that dwarfs every financial line, and it’s worth being concrete about how much sits in harm’s way rather than waving at a map. As of 2026, essentially all of TSMC’s leading-edge capacity, the N3, N2 and A16 nodes that earn the premium margins and drive the growth, is physically in Taiwan, roughly 130 km off a mainland that claims the island. The overseas fabs cover a small and less-advanced slice: Arizona is ramping N4/N5 and only later N3/N2, and Kumamoto (JASM) in Japan runs mature 12/16/22/28nm. Analysts generally estimate well over 80–90% of total output and effectively 100% of the sub-5nm volume remains on the island. So the revenue actually at risk from a blockade or conflict isn’t a rounding error, it’s the crown jewels: the AI and HPC business that this entire valuation rests on. A serious escalation wouldn’t just dent earnings, it would threaten the physical asset base and the global chip supply at once. No discount rate captures a binary like that. It’s why the stock will always trade at some discount to its cash flows, and why position sizing (which is a personal decision, not something I’d advise on) is the whole game for anyone who owns it.
- The capex bill keeps climbing. 2026 capex is guided at a record US$52–56 billion (TrendForce, Jan 15, 2026). Every dollar suppresses near-term free cash flow on the promise of later revenue. If AI demand cools before the fabs are absorbed, the FCF anchor of this valuation stays underwater.
- Customer concentration cuts both ways. The monopoly on the supply side is matched by concentration on the demand side: Apple and Nvidia together are widely estimated to account for north of 40% of TSMC’s revenue, with Apple alone historically around a fifth. That’s fine while both are booming. But the FCF-growth hurdle baked into the price leans hard on two customers. If Nvidia diversifies leading-edge orders to a revived Intel Foundry, or Apple’s unit growth stalls in a mature smartphone market, a big slice of the growth that justifies $432 walks out the door with them. The moat is real, but it points at a short customer list.
- Geographic dilution and cost. The US$165B Arizona build and the Japan fabs are strategically necessary (they de-risk the Taiwan concentration) but structurally less profitable, higher costs, lower yields early on. Management has quantified this on the calls: overseas fabs are guided to dilute gross margin by roughly 2 to 3 percentage points a year in the early ramp, widening to 3 to 4 points annually in the later years as the higher-cost capacity scales [VERIFY exact figures against the TSMC transcript]. And that dilution compounds with the depreciation wave from the section above: an Arizona fab is a fresh, higher-cost tranche of depreciation landing on the income statement at a lower yield than its Taiwan equivalent, hitting the gross-margin line from both sides at once. The globalization that reduces the tail risk is not free, it’s a standing 3-to-4-point drag on the very margin the bull case celebrates.
- Cyclicality. FY23 is the reminder: revenue can fall in a downcycle. The 27% growth in my base case is an upcycle number. Model it forever and you’ll overpay.
The bull case and the bear case don’t really argue about the business. They argue about a strait. On the numbers, TSMC is a monopoly compounding at 25% returns. On the map, it’s the single most contested piece of industrial real estate on the planet. Both are true at once.
So, great business, fair price?
Great business isn’t in question. Irreplaceable business, arguably, is the more accurate phrase, and that’s rarer.
At $432 you’re paying roughly a 13% discount to the Street’s $490 mean and sitting near the low end of a reasonable intrinsic range. The reverse-DCF says the price bakes in somewhere between 17% and 24% FCF growth for a decade, depending on your discount rate, a bar that’s easy on near-term revenue at the low end and gets harder only if you both doubt the AI cycle and refuse the balance sheet any credit. The trailing 60x EV/FCF multiple looks terrifying, but it’s terrifying because the record fab build is crushing the denominator, the same distortion that makes every heavy-capex compounder look expensive at the peak of its investment cycle.
What would change my mind? Two things, watched separately. First, the financial one: if HPC/AI revenue growth decelerates sharply while capex stays at record levels, that’s the market telling you the incremental returns on the fab build are cracking below the cost of capital, and the suppressed FCF becomes permanent rather than temporary. I’d watch the quarterly HPC mix and the capex guidance together at the July 16 report, not the headlines. Second, the one no chart can price: any material escalation across the Taiwan Strait resets the entire analysis, because you can’t discount a cash flow that a blockade interrupts. On the numbers, this is one of the best businesses in the world at a fair price. The asterisk is geographic, and it’s not small.
What’s your read on TSMC here, is the monopoly on leading-edge chips worth paying near fair value for, or does the Taiwan tail risk mean it should trade at a permanent discount no matter how good the numbers look? I’d like to hear how you’d price the geopolitical piece. Find me on X or LinkedIn.
Keep reading: for the same quality-versus-price lens applied to a hyperscaler mid-build, see my breakdown of why the market may be misreading Microsoft, and the rest of the Finance category works through more companies the same way.
Related analysis: the AI semiconductor value chain
TSMC is the indispensable middle of the chain. Following it in both directions:
- ASML at €1,634: The EUV Monopoly Priced for Perfection, TSMC’s key supplier; the EUV tools that make N2 and A16 possible.
- NVIDIA at $195: Priced for a Decade of 28% Growth, TSMC’s largest AI customer; designs the chips TSMC fabricates.
- Microsoft at $390: The Market Is Misreading a Hyperscaler and Meta at $583: Two Accounting Distortions Hiding a 22% Grower, the hyperscalers whose AI capex ultimately fills TSMC’s order book.
Data sourced from Yahoo Finance via my local analysis tooling, as of July 8, 2026. Business figures are computed from TSMC’s reported financial statements in New Taiwan dollars (NT$); per-share valuation figures are for the US ADR (TSM) in US dollars (one ADR = five ordinary shares). US-dollar business absolutes convert from TWD at 0.0312 (TWDUSD) as of that date and are approximate. This run’s data feed resolved to the US ADR rather than the Taipei listing, so I present the price in USD per ADR with a TWD lens on the statements; a raw EV/FCF of −0.05x in the feed was a USD-quote-versus-TWD-statement currency artifact and was disregarded, with the multiple recomputed on a consistent-currency basis (~62x trailing / ~35x forward). I also overrode the tooling’s mechanically-derived 7.3% WACC in favor of a ~9.75% equity-weighted rate as base, because TSMC’s near-zero net debt makes a debt-heavy blended rate inappropriate. Demand, guidance, and quote figures are from TSMC Investor Relations, its Q1 2026 (April 16, 2026) and Q4 2025 (January 15, 2026) earnings calls, and reported press, each linked and dated inline; forward assumptions are reconciled to management’s actual guidance and its prior-quarter guidance was checked against reported actuals (Q1 2026 beat the top of every band). Free cash flow is computed from the cash-flow statement (operating cash flow minus capex), not a data-feed summary field. Figures are illustrative and may lag or contain gaps; always cross-check against TSMC’s official filings before acting. Next earnings: July 16, 2026.