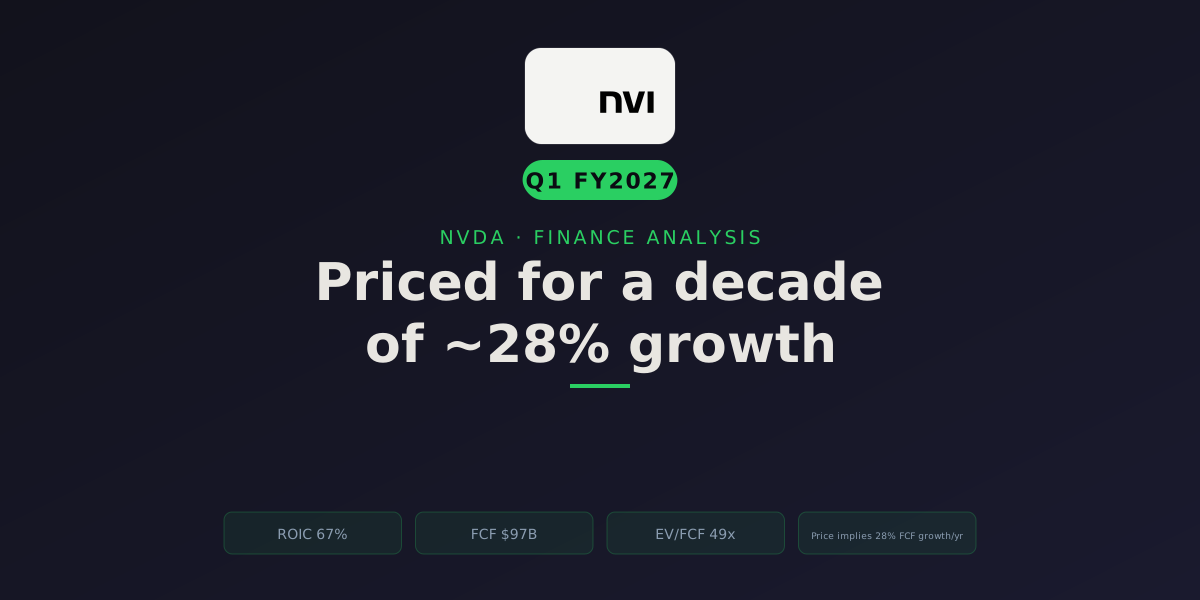
At $196.93, NVIDIA is priced for roughly 28% free-cash-flow growth every year for the next decade. That’s the number a reverse-DCF spits out, and it’s the whole story. The business is arguably the best I’ve ever put a spreadsheet against, a 67% return on invested capital, a 60% operating margin, and $96.7B of free cash flow off $215.9B of revenue in fiscal 2026. None of that is the question. The question is whether a company already doing $216B a year can keep compounding cash flow at nearly 30% until 2036 without a single serious stumble.
This is not a heavy-capex hyperscaler story, and that trips people up. NVIDIA is capital-light: it spent $6.0B on capex last year, about 3% of sales, and turned $102.7B of operating cash into $96.7B of free cash. It’s the toll booth on the AI-datacenter highway, not the company laying the asphalt. The moat is CUDA, the software layer that makes switching away from NVIDIA hardware expensive even when the chips get commoditized.
So the tension isn’t quality versus junk. It’s an extraordinary business against an extraordinary price. Every figure below is computed from the financial statements (Yahoo Finance data, as of July 8, 2026), not hand-picked to fit a conclusion. Let me show the work.
Return on invested capital: 67 cents of after-tax operating profit per dollar of capital. Against a ~14% cost of capital, that ~53-point spread is the quantitative fingerprint of the CUDA moat.
Operating cash flow ($102.7B) minus capex ($6.0B). A 45% FCF margin with capex under 3% of sales — NVIDIA converts revenue to cash like a software firm, not a chipmaker. No trough-FCF distortion to normalize.
Enterprise value over trailing free cash flow. Rich against the market, but it roughly halves on forward numbers as consensus expects FCF to nearly double. That trailing-vs-forward gap is the whole valuation debate.
The reverse-DCF hurdle: the FCF growth the current price already assumes for a decade at a 14.2% discount rate. For most companies that would be fantasy; for NVIDIA it is merely heroic. This is the bar the thesis must clear.
Returns on capital: the fingerprint of a real moat
Return on invested capital is where I always start, because it’s the quantitative fingerprint of a moat. A company that earns far more than its cost of capital, year after year, is doing something competitors can’t copy. NVIDIA’s ROIC went from 13% in FY2023 to 55%, then 80%, and it sits at 67% for FY2026. The dip from 80% to 67% is worth naming: it’s not deterioration, it’s the denominator. Invested capital nearly doubled to $165.8B as NVIDIA retained earnings faster than it could deploy them. When your problem is “too much cash,” you’re winning.
Against a weighted-average cost of capital of roughly 14.2% (more on why that’s high in a moment), a 67% ROIC is a spread most companies never touch. The gap between what NVIDIA earns on capital and what that capital costs is the value-creation engine, and it’s enormous.
Margins: 60% at the operating line, and holding
Operating margin is the profitability trend that matters here, and NVIDIA’s is staggering: 16% in FY2023, then 54%, 62%, and 60% in FY2026. That single-point dip from 62% to 60% is the only red flag the automated screen raised (one year of operating-margin decline), and it’s benign, gross margin eased from 75% to 71% as the Blackwell generation ramped and networking (lower-margin than raw compute) grew to a bigger slice. And the recovery already landed: fiscal Q1 2027 (quarter ended April 26, 2026) printed a 74.9% GAAP gross margin, and management guided Q2 to the same 74.9% (NVIDIA IR, May 20, 2026). So the Blackwell margin dip wasn’t a structural crack, it was a ramp, and it has reversed on schedule.
The point is direction and durability. A company holding a 60% operating margin while growing revenue 65% year over year is not seeing its pricing power erode. It’s seeing scale.
Free cash flow: capital-light, and that’s the whole point
Here’s what separates NVIDIA from the companies buying its chips. Microsoft, Amazon, Google, and Meta are pouring a combined ~$600–725B into data centers in 2026 (CNBC, April 29, 2026). Their free cash flow is suppressed by that build-out. NVIDIA sits at the other end of the pipe. It captures the revenue those hundreds of billions generate, and it does so with almost no capital intensity of its own.
Operating cash flow was $102.7B in FY2026. Capex was $6.0B. Free cash flow: $96.7B, a 45% FCF margin. There’s no trough-FCF distortion to normalize here, no capex super-cycle hiding the real earnings power. What you see is what the business throws off. FCF grew from $3.8B (FY23) to $27B, $61B, and now $97B, an almost 26x increase in three years.
One honest caveat on the multiple: at $197, NVIDIA trades at ~49x trailing EV/FCF and ~30x trailing earnings. That looks expensive against the market. Hold that thought, because on forward numbers it looks very different, and that gap is the entire valuation debate. Consensus models roughly 157% revenue growth into the next year, so the trailing multiples collapse: forward P/E drops to ~15x, and forward EV/FCF to ~19x. A ~30x business at ~15x forward is either a screaming bargain or a value trap that assumes growth that won’t arrive. The chart below is the whole argument in two bars.
Look at what happens when you plot profitability and cash generation on the same timeline: unlike a hyperscaler mid-build, NVIDIA’s operating margin and free cash flow climbed together.
Balance sheet: a fortress with $40B of net cash
There’s nothing to worry about here, and that’s the point of checking. Total debt is ~$11B against ~$51B of cash and short-term investments, so net debt is negative ~$40B. Net-debt-to-EBITDA is −0.24x, well on the safe side of the 2.5x line where leverage starts to constrain a business. Interest coverage is 503x, which is a rounding-error level of interest expense against operating income.
Why does a company this profitable carry any debt at all? Because it’s essentially free optionality, low-cost, and the cash cushion means the balance sheet is a shock absorber, not a liability. If AI-datacenter demand hits a digestion phase, NVIDIA doesn’t have a solvency question. It has a “how fast does growth resume” question. Very different risk.
One thing the net-cash line hides, though, and it’s the wrinkle to the fortress story: NVIDIA sits on a large book of inventory and non-cancelable purchase and capacity commitments to secure TSMC wafers and CoWoS advanced packaging. Those commitments run into the tens of billions and have grown alongside revenue (NVIDIA FY2025 10-K). In an up-cycle that’s just NVIDIA locking in scarce supply, a competitive advantage. But it behaves like a reverse float: NVIDIA pre-commits cash to capacity before the orders are firm, so if bookings freeze in a downturn, it’s the one holding pre-paid supply it can’t instantly unwind. Inventory and purchase-commitment growth is the balance-sheet line to watch as a downside-cycle tell, precisely because the headline net-cash number won’t flag it.
Capital allocation: buybacks, and a lot of them
Over the last five fiscal years NVIDIA generated $188B of free cash flow and returned about 50% of it via share repurchases, with only ~1.4% going to dividends (NVIDIA is not a yield stock and shouldn’t be). Capex took ~6.5%, acquisitions ~8%, debt paydown ~1.3%. The screen flags no dilution, net stock issuance was negative 18.6% of sales, meaning NVIDIA is a net repurchaser even after accounting for stock-based comp (which is a modest 3% of sales, low for a tech company its size).
A deliberate note on what’s not here: I’ve left out the dividend chart that my full stock template calls for, and that’s a decision, not an oversight. NVIDIA pays a token dividend, a trailing yield of roughly 0.02% and a payout ratio near 0.6% of earnings. At that level the dividend is a rounding error in the capital-return story and carries no signal about valuation or income; plotting it would imply a relevance it doesn’t have. The return of capital that matters here is entirely the buyback, so that’s where the analysis stays.
Jensen Huang owns a meaningful stake and has run this company since he co-founded it in 1993, so management’s incentives are closely tied to per-share value. The one capital-allocation item to watch is buyback timing: repurchases at ~49x FCF add per-share value only if the growth shows up. If it does, the repurchases will have been made below intrinsic value; if demand disappoints, they’ll have been made above it. It’s the same bet as the whole thesis, expressed through the treasury, and the metric to watch is buyback price against the intrinsic-value range.
The forward story: does the demand keep coming?
Numbers are backward-looking. The 28% bar the market has set is a bet on the next decade, so it’s worth grounding in what’s actually happening right now.
The most recent quarter (fiscal Q1 2027, reported May 20, 2026) was a record: $81.6B in revenue, up 85% year over year and up 20% sequentially, with data center revenue of $75.2B, up 92% (NVIDIA IR, May 20, 2026). Management guided Q2 to $91.0B ±2%, up another ~12% sequentially, and here’s the striking part: that outlook assumes zero data center compute revenue from China. NVIDIA has effectively been foreclosed from the Chinese data center market, and it’s still guiding up double digits sequentially.
One thing to weigh before you trust that guide: NVIDIA has a habit of setting the bar low and clearing it. Through the Blackwell ramp the company has guided conservatively and then beaten, quarter after quarter. Q1’s $81.6B came in above the ~$78B the Street was modeling off the prior guide, and the gross-margin recovery I flagged above (back to 74.9%) arrived exactly when management said it would. A $91B guide from a team with that track record is more floor than ceiling. That credibility is itself part of the bull case, and it’s the reason I’m comfortable using a growth path in the DCF that leans on the recent trend rather than a punitive haircut.
Jensen Huang · Founder & CEO, NVIDIA
Q1 fiscal 2027 results, May 20, 2026
“The buildout of AI factories — the largest infrastructure expansion in human history — is accelerating at extraordinary speed. Agentic AI has arrived, doing productive work, generating real value and scaling rapidly across companies and industries. NVIDIA is uniquely positioned at the center of this transformation as the only platform that runs in every cloud, powers every frontier and open source model, and scales everywhere AI is produced — from hyperscale data centers to the edge.”
The number under that language is what matters for the model. A $91B quarterly run-rate annualizes to roughly $360B, and it’s being set with China Data Center compute revenue guided to zero. The reverse-DCF’s 28% decade-long hurdle doesn’t need next quarter to be heroic, it needs this trajectory not to snap.
Which raises the question the bull case would rather skip: who is actually buying the $360B? Almost all of it flows through a handful of pockets. Here’s what NVIDIA actually discloses versus what gets inferred, because the distinction matters. The 10-K states that a small number of unnamed direct customers each account for more than 10% of revenue, and that a couple together crossed 30% in a recent quarter (NVIDIA FY2025 10-K, via Reuters, February 2025). NVIDIA does not name them; the frequently cited “Microsoft, Meta, Amazon, Google, Oracle drive ~40–50% of data-center revenue” figure is an analyst estimate, not a filed number (Bloomberg / analyst estimates, 2026). Treat it as directional, not precise, some of NVIDIA’s direct customers are OEMs and system integrators who resell to the hyperscalers, so end-demand concentration is fuzzier than the reseller-level 10% disclosures suggest. Even discounted, the shape of the risk holds: the 28% hurdle isn’t a bet on “the market,” it’s a bet on a small syndicate of capital-allocation committees not blinking at the same time. If one big buyer cuts orders 20%, that’s a visible hole in the curve the price underwrites.
The partial offset is inference, not just training. As deployed AI models shift from being trained to actually serving billions of queries, a growing share of GPU demand becomes recurring inference workload tied to end-user usage rather than to one-off training-cluster build-outs. Inference demand is stickier and less lumpy than training capex, and if it becomes the dominant driver, it softens both the concentration risk (usage is broader than the training-cluster buyers) and the digestion risk (you don’t “finish” serving traffic the way you finish a training run). The falsifiable read: watch whether NVIDIA and its customers describe demand as increasingly inference-led. If they do, the air-pocket thesis weakens; if data-center revenue stays training-cluster-driven, the lumpiness and concentration risks stay fully live.
Blackwell is in full volume production and demand-constrained, with the next-generation Vera Rubin platform targeted for production shipments in the second half of 2026 (Tom’s Hardware, March 2026). And the demand signal from customers is enormous, the big-four hyperscalers raised 2026 capex guidance again in late April, toward a combined ~$725B.
Huang’s own framing, from the GTC 2026 keynote:
“I see through 2027 at least $1 trillion. In fact, we are going to be short. I am certain computing demand will be much higher than that.”
— Jensen Huang, NVIDIA CEO, GTC 2026 (Fortune, March 17, 2026)
CEOs talk their book. But the order book, the RPO, and the hyperscaler capex commitments corroborate the direction, even if the magnitude is a guess.
What is NVIDIA actually worth?
Now the hard part. And I want to be honest about the method, because this is a case where a naive multiple and a growth DCF disagree by a factor of four, and pretending otherwise would be malpractice.
Start with the reverse-DCF, because it’s the most defensible number. Instead of guessing the future, ask what the current price already assumes. At $196.93, discounting NVIDIA’s $96.7B of free cash flow at its ~14.2% cost of capital with a 3% terminal growth, the market is pricing in 28.3% annual FCF growth for ten years. That is the hurdle. To clear it, NVIDIA would roughly 12x its free cash flow by 2036, to well over a trillion dollars a year. For almost any company on Earth, that’s fantasy. For NVIDIA, given a business that grew FCF 26x in three years and a CEO pointing at a trillion-dollar demand pipeline, it’s merely heroic. Possible, not comfortable.
Why is the WACC so high? NVIDIA’s beta is 2.21, more than double the market. High beta means high sensitivity to market swings, and CAPM translates that into a ~14.2% discount rate. That’s a punishing hurdle, and it works against the valuation. A more forgiving 10–11% rate (arguably fair for a company with a fortress balance sheet and a wide moat) would lift every fair-value estimate below. I’m keeping the model’s 14.2% to stay conservative, but know that it’s a headwind baked into these numbers.
The DCF sensitivity ladder. A single DCF number is a point on a knife-edge. Here’s how fair value moves with the growth assumption (10-year FCF DCF, 14.2% WACC, 3% terminal, 24.2B shares):
| Annual FCF growth | Fair value / share (14.2% WACC) |
|---|---|
| 24% (bear) | ~$148 |
| 30% (base) | ~$221 |
| 36% (bull) | ~$328 |
A few points of growth swing fair value by nearly $200. Anyone who quotes you a single NVIDIA price target without this ladder is selling false precision. The honest takeaway: at $197, the market sits between the base and bear cases of a 14.2%-discount-rate DCF, which is another way of saying the price is demanding.
But the discount rate is doing as much of the work as the growth rate, and it deserves the same scrutiny. That 14.2% is almost entirely a function of NVIDIA’s 2.2 beta. Drop the WACC to a still-defensible 10.5%, the sort of rate you’d apply to a wide-moat, net-cash compounder if you didn’t let trailing volatility dominate the input, and the same growth path produces very different numbers:
| Annual FCF growth | 14.2% WACC | 10.5% WACC |
|---|---|---|
| 24% (bear) | ~$148 | ~$253 |
| 30% (base) | ~$221 | ~$387 |
| 36% (bull) | ~$328 | ~$586 |
At 10.5%, the base case ($387) sits nearly double the price, and even the bear case ($253) clears $197 comfortably. In other words, most of the “fair-to-full, only ~14% cushion” conclusion is the punitive beta talking, not the business. I keep the 14.2% number as my headline to stay conservative, but a reader should understand that the discount rate, not the fundamentals, is what makes NVIDIA look expensive here. Move the beta assumption a little and the whole verdict tilts toward “cheap.”
Now the multiple-model artifact. The automated multiple valuation spits out a “fair value” of ~$77, a 61% downside. Ignore it, and here’s precisely why. It applies today’s forward multiple to current metrics without crediting the growth. That’s the mirror image of the trough-FCF trap I flag on hyperscalers: for a company still compounding at 40%+, a normal multiple on this year’s earnings systematically understates it. NVIDIA’s PEG is 0.6 and its forward P/E is ~15x against a trailing ~30x, precisely because analysts expect earnings to nearly double. Valuing a 90%-data-center-growth business on a static multiple is like valuing a homebuilder on the year it’s buying land. The $77 is a category error, not a bear case.
Reconciling to a range. The truth is in the messy middle. Throw out the $77 static-multiple floor (a category error) and the $328 blue-sky ceiling (needs 36% growth for a decade). What’s left is a blended intrinsic range of roughly $150 to $330, with a base case near $220, a touch above where the stock trades. The market is applying essentially no discount and no premium to a 14.2%-WACC base case. It’s pricing NVIDIA as a great business at a fair-to-full price, with the risk that the discount rate itself (that 2.2 beta) does a lot of damage in any risk-off tape.
Intrinsic value · the verdict
Blended fair value
$224
Current price
$197
Margin of safety
14%
Reverse-DCF check: at $197 the market is implicitly pricing in roughly 28% annual free-cash-flow growth for the next decade. The question isn't whether the business is great. It's whether it can clear that bar.
Fair values from multiple methods (see above). Source: Yahoo Finance (computed from financials) · as of July 2026. Illustrative, assumption-driven, not a price target.
Two margins of safety. Against my blended intrinsic base case (~$224), the stock offers a slim ~14% cushion, thin for a name this volatile. Against the Wall Street consensus, the picture is friendlier: 58 analysts carry a mean target of $301.62 with a “strong buy” consensus, so at $197 you’re buying at roughly a 35% discount to the Street. Which margin you trust depends on whether you believe the DCF or the analysts, and the honest answer is that both rest on the same 28%+ growth assumption. There’s no free lunch hiding in the difference.
The one bet this all reduces to: does AI-datacenter demand stay durable enough for NVIDIA to compound free cash flow at ~28% for a decade, or does hyperscaler capex hit a digestion air-pocket first? Everything, the buybacks, the multiple, the DCF, the analyst targets, rides on that single question.
Tailwinds and headwinds, tied to the number
Tailwinds (what keeps 28% alive):
- Data center revenue up 92% YoY last quarter, with China contributing essentially zero, meaning the growth is coming from the rest of the world with upside optionality if China ever reopens (NVIDIA IR, May 2026).
- Hyperscaler 2026 capex raised again in April toward ~$725B combined; Amazon alone guided ~$200B, the largest single-year corporate capex on record (CNBC, April 29, 2026).
- The CUDA software moat raises switching costs even as competitors close the hardware gap. This is why the moat is widening in software while the hardware lead is defended, not permanent.
- Blackwell demand-constrained; Vera Rubin ramping in 2H 2026, keeping the product cadence ahead of rivals.
Headwinds (what breaks it):
- The digestion risk. Hyperscaler capex at ~$725B can’t compound at these rates forever. When it plateaus, NVIDIA’s growth decelerates and a ~49x FCF multiple gets re-rated hard.
- Customer concentration. A handful of buyers, roughly five hyperscalers at 40–50% of data-center revenue, sets the growth curve. That’s not diversified demand; it’s a syndicate. Any one of them trimming orders punches a visible hole in the trajectory the price assumes.
- The depreciation time-bomb, on the customers’ books. This is the risk almost nobody prices. Hyperscalers capitalize their NVIDIA GPUs and depreciate them over 5–6 years, and several extended those useful-life assumptions in 2023–2025, which flattered reported earnings. But the hardware is architecturally stale in ~2–3 years, Hopper gave way to Blackwell gave way to Rubin. Here’s the two-sided sensitivity that makes this so hard to price. If a hyperscaler reverts its GPU depreciation schedule toward the real 2–3-year cadence, its near-term reported earnings compress (more depreciation per year), but the shorter book life also pulls forward refresh demand, arguably a tailwind for NVIDIA. If instead it rides the slow 5–6-year schedule to protect reported margins, replacement orders stall and you get a demand air-pocket, the bear trigger. Which way it breaks is knowable from one disclosure: the share of NVIDIA’s data-center revenue that is replacement of aging GPUs versus net-new capacity. NVIDIA doesn’t split it out, but as of FY2026 the vast majority is still net-new build (the installed base is only a few years old), which is why the schedule mismatch hasn’t bitten yet. The moment replacement becomes a large slice of data-center revenue and a hyperscaler is riding the slow schedule, the air-pocket is live. That’s the falsifiable line to watch, and the fragility sits in the customers’ accounting, not on NVIDIA’s near-trivial balance sheet.
- Custom silicon. Google’s TPUs, Amazon’s Trainium, Meta’s MTIA, and Broadcom-designed accelerators are real. The Anthropic–Google deal reportedly involves up to 1M TPUs. Every custom chip is a data-center socket NVIDIA doesn’t fill.
- AMD’s MI450 anchoring 6-gigawatt commitments from both OpenAI and Meta (AMD IR). Competition is arriving at the high end, not just the fringes.
- China: NVIDIA has “largely conceded” the Chinese data center market, its Q2 guide books zero China Data Center compute revenue, and it has yet to earn revenue from approved H200 licenses (CNBC, June 24, 2026). What’s left at risk is optionality, not a base-case revenue stream, the guide already assumes it’s gone.
- The 2.2 beta itself. In any market drawdown, high-beta megacaps get hit first and hardest, independent of fundamentals.
Great business, fair price
I keep coming back to the same discomfort. NVIDIA is, on the numbers, the finest business I’ve analyzed, 67% returns on capital, 45% FCF margins, a fortress balance sheet, a founder-CEO, and a software moat that competitors can’t easily route around. If quality alone set prices, you’d back the truck up.
But quality is in the price. At $197 you’re paying for a decade of ~28% cash-flow growth with a 14.2% discount rate working against you, and the entire thesis rests on hyperscaler capex that has to keep defying gravity. The falsifiable line is clean: watch the next two or three quarters of data-center revenue and, more importantly, watch the hyperscalers’ capex guidance. The day Microsoft, Amazon, Google, or Meta guides capex down, the 28% assumption cracks, and a ~49x FCF multiple doesn’t survive a growth scare. That’s the tell. Not NVIDIA’s own numbers, its customers’, and specifically the five customers whose depreciation schedules and capex committees quietly hold the growth curve in their hands.
What’s your read on NVDA at these levels? Is 28% FCF growth for a decade heroic-but-doable, or is the market underwriting a fantasy? I’d genuinely like to hear the bear case, come argue it with me on X or LinkedIn.
Keep reading: For the mirror-image setup, a company whose free cash flow is suppressed by its capex build rather than supercharged by capital-lightness, see my breakdown of Microsoft as a hyperscaler mid-build-out and how Meta’s double distortion masks its real cash generation. More company deep-dives live on the Finance category page.
Related analysis — the AI semiconductor value chain
NVIDIA designs the chips, but it owns neither the fab nor the tools. Following the chain up and down:
- TSMC at NT$2,445: The Foundry the World Can’t Replace — fabricates every NVIDIA accelerator; the single point of dependence.
- ASML at €1,634: The EUV Monopoly Priced for Perfection — the lithography monopoly that makes TSMC’s leading-edge nodes possible.
- Microsoft at $390: The Market Is Misreading a Hyperscaler and Meta at $583: Two Accounting Distortions Hiding a 22% Grower — the customers whose ~$725B combined 2026 capex drives NVIDIA’s demand.
Research note: Financial figures are computed from NVIDIA’s reported statements via the Yahoo Finance data service, as of July 8, 2026; valuation inputs (WACC, growth, targets) are derived from the data, not hand-picked to fit a conclusion. Forward-looking news and quotes are cited inline with sources and dates; cross-check pivotal figures against NVIDIA’s 10-K/10-Q filings on SEC EDGAR. Rubin Ultra timing and some China export details are reported inconsistently across sources and should be treated as unsettled. This analysis was drafted with AI research assistance; all numbers, sources, and the analysis are the author’s own.