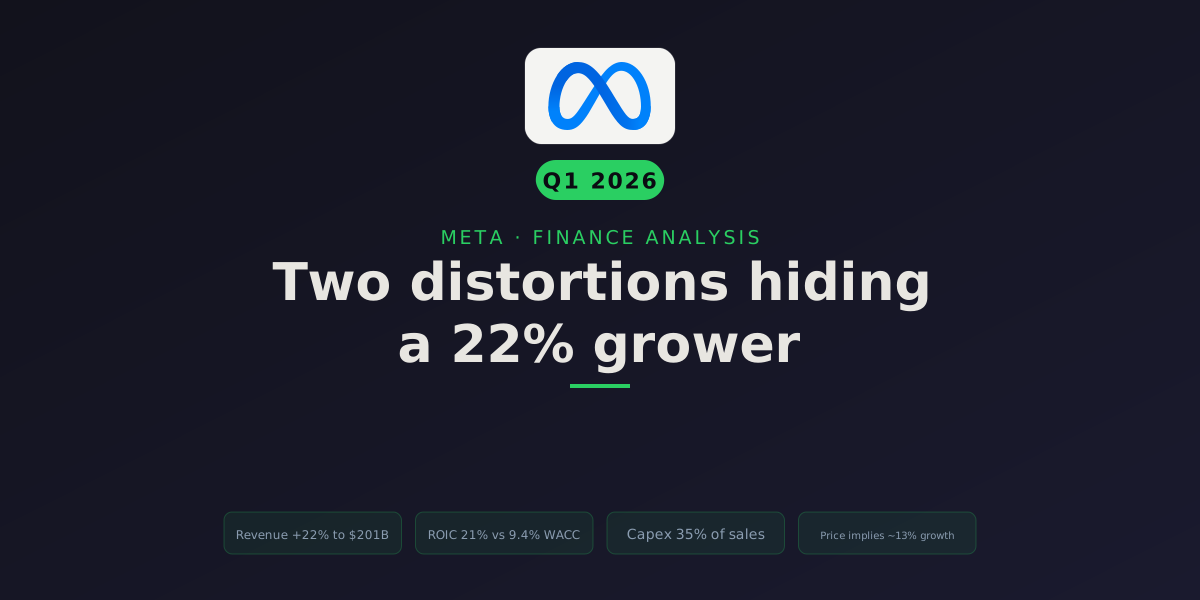
Two numbers in Meta’s 2025 results look like trouble. Net income fell 3%, from $62.4 billion to $60.5 billion. Free cash flow fell 15%, from $54.1 billion to $46.1 billion. A quick glance says: earnings shrinking, cash shrinking, priced for a fall.
Now the two numbers that were sitting right next to them. Operating income rose 20%, from $69.4 billion to $83.3 billion. Operating cash flow rose 27%, to $115.8 billion. Revenue grew 22% to $201 billion. So the profit engine got dramatically bigger while the two headline “results” everyone reads went backward. That is not a business in trouble. That is a business wearing two accounting costumes at once, and both come off.
The net-income drop is a single non-cash tax charge. The free-cash-flow drop is capex, the AI data-center build. Neither is a deterioration in the underlying business, and both distort in opposite directions to the truth. My job here is to strip off both costumes, value Meta as the heavy-capex compounder it now is, and be honest about the one thing that actually matters: whether that AI spend earns its return. Every figure below is computed from Meta’s own statements; the discount rate and growth rate are derived from the financials, not hand-picked.
Revenue grew 22% to $201 billion in 2025 and re-accelerated to +33% in Q1 2026, the fastest quarterly pace since 2021. For a company this size, sustained 20%-plus growth is rare and is what a high valuation has to be justified against.
Return on invested capital of 21% is more than double Meta’s ~9.4% cost of capital, the fingerprint of a moat. The dip from 29% is a one-time tax rate plus a capex-swollen denominator, not the business decaying.
Capex jumped to 35% of sales as Meta builds AI data-center capacity. This is the single reason free cash flow fell in a record cash-generation year, and the reason you cannot value Meta on trough reported FCF.
Run the cash flows backward from today’s price and the market implies only ~13% annual FCF growth for a decade, into a business posting 22% revenue growth. The bar the price sets is below what the company is doing, if free cash flow stays positive.
Distortion one: the tax charge that ate net income
Start with the strangest line in the 2025 income statement. Pretax income rose to $85.9 billion. The tax provision jumped to $25.5 billion, pushing the effective tax rate to 30% — roughly double the ~12% Meta paid in 2024. That single jump is what dragged net income below the prior year.
It wasn’t a cash bill. In Q3 2025 Meta booked a $15.93 billion non-cash charge, a valuation allowance against U.S. federal deferred tax assets, triggered by the One Big Beautiful Bill Act (OBBBA) interacting with the Corporate Alternative Minimum Tax. Meta stated that absent the charge, its 2025 effective rate would have been about 13% (Meta Q3 2025 earnings call transcript, 2025-10-29). The kicker: the same law lets Meta immediately expense domestic R&D, which lowers future cash taxes. And in Q1 2026 Meta booked an $8.03 billion tax benefit partially reversing the charge, and guided a normalized 13–16% tax rate for the rest of 2026.
So read the net-income line honestly and it’s the opposite of a warning. A non-cash accounting entry made GAAP earnings look worse in the same year cash taxes were heading lower. Reverse the artifact, hold the ~13% rate, and 2025 net income lands north of $70 billion. The business grew; the tax line lied.
Distortion two: capex ate free cash flow
Free cash flow is operating cash flow minus capital expenditure. Meta’s operating cash flow surged 27% to $115.8 billion in 2025, a record. Yet free cash flow fell to $46.1 billion. The whole gap is one line: purchases of property and equipment nearly doubled to $69.7 billion, or 34.7% of sales, up from roughly 23% in 2024. This is the AI and “superintelligence” infrastructure build-out, and it mechanically compresses today’s free cash flow in exchange for revenue that lands over the next several years. And $69.7 billion is only the 2025 actual — management has guided 2026 capex to $125–145 billion, so the figures climb through this piece: I use the $69.7 billion actual for the 2025 numbers and the ~$130 billion guide midpoint when I model the years ahead.
Here’s the visual that tells the whole story. Operating cash flow (left bar) pulls away to a record while free cash flow (right bar) sags in 2025 — and the widening gap between the two is the capex line, which nearly doubled to $69.7 billion.
To see the capex line explicitly, here it is against sales — the intensity jumping from 23% to 35% is the entire reason free cash flow fell in a record cash-generation year.
Put profitability and cash on the same picture and the point lands: margin barely moved while free cash flow fell.
One data-integrity note before anyone quotes an even scarier FCF figure. Meta’s owner-earnings free cash flow (EBITDA minus maintenance capex, interest, taxes, working-capital change) reads just $9.6 billion for 2025. That’s because the formula treats the entire $69.7 billion capex as maintenance, which for a company building brand-new AI capacity it plainly is not. Most of that spend is growth capex, not upkeep. If you cite Meta’s FCF, say which definition you mean. The honest number for valuation is the $46.1 billion standard FCF, and even that is depressed by the build.
This is the classifier that changes everything downstream: Meta is now a heavy-capex infrastructure builder mid-build-out, not the capital-light ad business it was in 2020. You cannot value one on trough reported free cash flow, any more than you’d value a homebuilder on the year it bought all its land. Read the $46 billion at face value and you conclude the stock is expensive. Normalize the capex intensity and the picture shifts hard.
One important clarification, because the label matters for the thesis: Meta is not a hyperscaler. A hyperscaler — AWS, Microsoft Azure, Google Cloud — rents its data-center capacity to third parties as a revenue line. Meta builds hyperscale infrastructure, but as of today it consumes essentially all of it internally, to serve ads and run its own AI; it does not sell cloud. So the capex carries the cost profile of a hyperscaler (the depreciation wave, the multi-year build) without — yet — the offsetting third-party cloud revenue. That could be starting to change: management has flagged “third-party cloud spend” in its own cost commentary, and analysts have begun pricing in a nascent external-compute angle (BofA’s July 2026 note framed Meta’s spare capacity as “a strategically valuable asset” as global AI capacity stays scarce). But that is optionality, not a business line today — so this analysis values Meta as an ad company funding an internal infrastructure build, and treats any external-cloud revenue as upside the model does not assume.
The engine underneath both costumes is still exceptional
Return on invested capital is the first number I check, because it answers the only question that matters about a business: when management reinvests a dollar, do they create more than a dollar of value? The bar to clear is Meta’s own ~9.4% cost of capital (the reference line on the chart below). Meta’s ROIC ran 17% → 22% → 29% → 21% across 2022–2025 — more than double the hurdle in every one of those years, even the depressed one. The 2025 dip isn’t decay. Two things pushed it down, and both trace back to the distortions above: the inflated 30% tax rate cut into after-tax operating profit (NOPAT), and the capex surge swelled the invested-capital denominator before the AI revenue lands. Strip the one-time tax rate back to ~13% and NOPAT-based ROIC would sit comfortably in the high-20s again.
And the top line is re-accelerating. Full-year revenue growth ran 15.7% in 2023, then 21.9%, then 22.2% in 2025 — each annual bar higher than the last. Then Q1 2026 revenue grew 33% year over year (a single quarter, not an annual run-rate), the fastest quarterly pace since 2021, powered by AI-driven ad ranking (the Andromeda and GEM models) lifting both price per ad and impressions. A flat five-year CAGR of ~20% buries that acceleration. The trend is up and to the right, not fading.
The balance sheet is a fortress backing all of it. On a total-liquidity basis (cash, equivalents and marketable securities) Meta holds about $81 billion, against roughly $84–87 billion of gross debt (including finance leases), for net debt of just $5.6 billion on $105 billion of EBITDA — a net-debt/EBITDA of 0.05x, effectively unlevered. Interest coverage is 71x and the current ratio is 2.35. One distinction worth keeping straight, because the chart below shows the narrower line item: cash and equivalents alone actually fell to $35.9 billion in 2025 (Meta shifted the balance into marketable securities as gross debt rose to fund the build), yet total liquidity stayed near $81 billion, which is why net leverage barely moved. This is the crucial enabler of the whole thesis: Meta can fund the escalating capex — $69.7 billion in 2025, guided to $125–145 billion in 2026 — from operating cash flow and a pristine balance sheet, without the leverage that would make the AI bet existential.
Leverage stays trivial: on the total-liquidity view net-debt/EBITDA has never left the −0.1x to 0.5x band across these four years — a rounding error for a company generating $116 billion of operating cash flow.
Where the money goes — and the one real red flag
How a company spends cash is the clearest read on how management thinks. Over the last five years Meta’s cumulative capital allocation looks like this: capex equal to 101% of free cash flow, buybacks 64%, dividends 6% (a recently initiated payout), acquisitions 2%. The percentages sum past 100% because each is measured against free cash flow defined before that reinvestment, so read it as relative emphasis: Meta reinvests aggressively and returns the rest through repurchases.
On the classic warning-sign screen (declining sales, margin compression, negative cash flow, sub-10% returns, excessive leverage), Meta trips almost nothing: zero years of sales decline, one year of slightly lower operating margin, no negative-FCF years, ROIC never below 10%, leverage negligible. The one flag that fires is real, though: stock-based comp at 10.2% of sales, about $20.4 billion in 2025. Meta’s buybacks more than mop up the dilution (net share issuance was negative), but SBC is a genuine cost being handed to employees, and it grew faster than revenue. Watch it.
The dividend is a footnote to all of this, and honestly it should be. Meta only started paying one in early 2024, and it’s tiny by design: the current yield is about 0.35%, the payout ratio just 7.6% of earnings, and it grew a token 5% (from $2.00 to $2.10 per share) in its first raise. This is not a dividend story; it’s a symbolic signal from a company that would rather plow cash into capex and buybacks. For a business reinvesting at 21% ROIC, that’s the right call. The chart below shows why the yield line keeps drifting down even as the payout rises: the share price has climbed faster than the dividend, which tells you the market is paying for growth, not income.
There’s a governance fact you have to price in before you trust any of this, because it shapes who decides the spend. Through Class B super-voting shares, Zuckerberg holds roughly 13% of the economics but about 61% of the voting power (Meta 2025 proxy statement, SEC EDGAR). In practice that means founder control: the board and outside shareholders can’t easily overrule the CEO on capital decisions. This is a structural fact with two readings, and both are worth holding. For the bull it’s a feature — a founder who can invest through the cycle can fund a multi-year AI build without flinching at quarterly-earnings pressure, which is how durable leads get built. For the bear it’s a concentration of decision-making: Reality Labs’ $19.2 billion 2025 operating loss and the rising $125–145 billion capex guide are large, discretionary commitments that outside holders have limited formal means to resize if the returns don’t materialize. Neither reading is a verdict on management’s judgment — the record on their core ad-and-AI reinvestment has been strong (see the ROIC and promise-vs-delivery sections). It’s simply the right way to frame the risk: the payoff on this spend rests more on the controlling founder’s conviction than on an external check, so the metric to watch is whether the incremental returns show up on schedule.
One thing worth doing before you trust any of management’s forward numbers: score the last set of promises against what actually happened. Meta opened 2025 guiding roughly $60–65 billion of capex, raised the range through the year as demand ran hot, and delivered $69.7 billion ($72.2 billion including finance leases). It landed at the top of a guide it kept lifting, not below one it set. Same pattern on expenses: the full-year total came in inside the guided band. Management here under-commits on spend and then spends more, which is the opposite of the miss you’d fear. And the tell that matters most for the capex bet: the spend has so far been followed by accelerating revenue (Q1 2026 up 33%), not the deceleration a wasted build would produce. That track record is why I’m willing to take this year’s $125–145 billion capex guide and 13–16% tax guide at face value rather than haircutting them.
The price — start with what $616 already assumes
Here’s where it gets interesting, because the standard valuation tools point in wildly different directions on Meta right now, and the disagreement is the analysis. So I’m not going to pick a favorite number and bury the rest. I’m going to walk them in order, starting with the one I trust most.
Forget “what should it be worth?” for a second and ask the sharper question: what does today’s price already assume? At $615.58 (as of July 8, 2026), discounting Meta’s cash flows back at its own ~9.4% cost of capital, the market implies roughly 12.9% annual free-cash-flow growth for the next ten years before a terminal 3% perpetuity. Think of that as a hurdle. Meta grew revenue 22% last year and 33% last quarter, and it has compounded revenue near 20% for five years. For the price to be merely fair, growth has to nearly halve from here and stay halved for a decade. The bar the market has set is low relative to the company’s own track record, if free cash flow stays positive. That is the anchor of everything below.
Now the other methods, and why each one is either fragile or misleading on its own.
The DCF is a knife-edge, not an answer. Feed the ~20% trend growth and ~9.4% WACC into a discounted-cash-flow model on the $46 billion (trough) free cash flow and fair value lands near $1,229 a share. But that base case is one point on a very steep line, and showing it alone would mislead you about the confidence:
| DCF growth assumption | Fair value per share |
|---|---|
| 16% (below trend) | ~$909 |
| 20% (the trend) | ~$1,229 |
| 24% (recent quarters’ pace) | ~$1,654 |
A single-digit change in one assumption swings the answer by hundreds of dollars. Anyone who quotes you “$1,229” as the fair value is selling you false precision. The DCF is useful for direction, not for a decimal point.
The multiple model is anchored to a trough. The data-derived multiple model, built off forward figures, lands near $469 a share, about a 24% margin of safety below the $616 price, i.e. it says overvalued. But look at why. It capitalizes today’s capex-crushed $46 billion free cash flow as if that were the run-rate. That is exactly the homebuilder-in-its-land-buying-year error: you’re annualizing the single worst FCF year of the build and calling it normal. The $469 isn’t the “prudent” case; it’s a category mistake that treats growth capex as if the business will never earn a return on it.
Notice how far the forward multiples fall as the two distortions unwind: forward P/E under 17x, forward EV/FCF to about 23x. A ~17x forward P/E on a business growing revenue 22% (a PEG near 0.87) is not, on any normal reading, an expensive stock.
What is it actually worth?
Most valuations quietly cheat: someone picks a growth rate and a discount rate that produce the answer they wanted. I want inputs the financials imply, so both are computed.
- Growth (≈ 20%) — not a flat CAGR, which buries the acceleration. Year by year revenue growth runs 15.7% → 21.9% → 22.2%, with Q1 2026 at 33%. The recency-weighted trend (~21%) blended with analyst consensus (~19.5% next year) lands at 20.3%, capped there for prudence even though recent quarters run hotter.
- Discount rate (WACC ≈ 9.4%) — derived via CAPM from Meta’s beta of 1.25, a 4.3% risk-free rate, and a 4.5% equity risk premium, weighted for its near-zero net debt. That’s a fair, not punitive, rate for a fortress-balance-sheet mega-cap.
So where does the truth sit? Not at the $469 trough-multiple floor, which prices the build as permanent damage. Not at the $1,229 DCF ceiling, which assumes 20% growth holds cleanly for a decade and the capex converts on schedule. It sits in the messy middle, and the reason the market applies a discount to the blue-sky DCF is legible: Meta has committed to $125–145 billion of capex this year that is locked in regardless of whether the AI revenue shows up on time, and the return on that capex is genuinely unproven. My honest read: fair value is a wide range centered in the $750–$950 zone, and the analyst consensus of $828 (58 analysts, mean target) is a reasonable center of gravity inside it.
Intrinsic value · the verdict
Blended fair value
$828
Current price
$616
Margin of safety
26%
Reverse-DCF check: at $616 the market is implicitly pricing in roughly 13% annual free-cash-flow growth for the next decade. The question isn't whether the business is great. It's whether it can clear that bar.
Fair values from multiple methods (see above). Source: Yahoo Finance + computed WACC/growth · as of July 2026. Illustrative, assumption-driven, not a price target.
Worth being concrete about what buying at $616 actually is, because a range is only useful if you can act on it. You are not underwriting the $1,229 blue-sky DCF. You are buying at roughly an 18% discount to the low end of my $750–$950 intrinsic range and a ~26% discount to the $828 Street consensus. Two independent margins of safety, both pointing the same way. Those are facts about the gap between price and estimated value, not a nudge to buy.
And the whole thing reduces to one nameable bet: does the incremental return on invested capital from this AI capex clear Meta’s ~9.4% cost of capital over the next five years? Everything else is a footnote to that. Clear the bar and the reverse-DCF’s ~13% hurdle is trivially met, FCF normalizes upward as capex intensity stabilizes, and the $469 floor was a mirage. Miss it and the $46 billion trough FCF isn’t a temporary dip, it’s the new normal, and the cheap-looking model was right all along.
The person who framed the downside most bluntly is the one making the bet. Asked whether AI infrastructure spending had run into bubble territory, Zuckerberg didn’t wave it away:
Mark Zuckerberg · Founder, Chairman & CEO
Access podcast, September 2025
[An AI bubble is] definitely a possibility. … If we end up misspending a couple hundred billion dollars, that's going to be very unfortunate.
That’s the CEO who signs the checks conceding the exact tail risk the bear case rests on. It cuts both ways: he’s said elsewhere that he judges the cost of under-building an AI lead higher than the cost of overspending, so the concession is a rational actor pricing an asymmetry, not a red flag being buried. Either way, it’s the reverse-DCF’s question, stated in dollars by the one person with the most information about the return.
Tailwinds and headwinds
A DCF is only as good as the growth story behind it, and every point below is really a vote on that one bet: does the capex earn its cost of capital?
Tailwinds — what gets you toward the top of the range:
- AI ad tools at a $60B annual run-rate. Zuckerberg put the figure on the Q3 2025 call, with price per ad up 10% year over year and impressions up 14%, driven by the Andromeda and GEM ranking models (Meta Q3 2025 earnings call, 2025-10-29). This is AI capex already converting into ad revenue — the clearest evidence the bet is being won.
- Meta AI past 1 billion monthly actives, which Zuckerberg framed as the “next thing” to monetize (same call). A billion-user surface with no meaningful revenue yet is optionality the DCF barely credits.
- Messaging and Reels monetization ramping. Reels is past a $50 billion run-rate; click-to-WhatsApp ads grew about 60% year over year; business messaging is early. As BofA’s Justin Post put it (Buy, $835, 2026-07-03), “Meta is building a strategically valuable asset at a time when global AI capacity remains scarce” (TipRanks).
- New hardware surfaces. The Ray-Ban Display glasses “sold out in almost every store within 48 hours”; Threads passed 150M daily actives; Instagram reached 3 billion monthly users (Q3 2025 call). Baird’s Colin Sebastian (Outperform, $830) sees “a future where users will be able to utilize Instagram/FB beyond social interactions for more proactive search/discovery” (TipRanks).
Headwinds — what pulls it toward $469 or below:
- The FCF-negative risk — the sharpest bear point. JPMorgan’s Doug Anmuth downgraded Meta to Neutral, cutting his target from $825 to $725 (2026-04-30), modeling capex climbing toward ~$202 billion by 2027 and pushing Meta to negative free cash flow (about −$4B in 2026, −$24B in 2027). He argues Google and Amazon are “better positioned with more complete AI stacks” (TipRanks, 2026-04-30). This is the point that breaks the DCF: if starting FCF goes negative, the anchor of every bull model disappears.
- The revenue line is not a fixed input — it’s cyclical. I’ve stress-tested the capex line to death, so it’s only fair to stress the other side of the DCF. Meta’s ~22% growth is not a constant; it’s ad revenue, and ad revenue is one of the most cyclical lines in the economy. In 2022, when rates spiked and advertisers pulled back, Meta’s full-year revenue fell 1% and the stock lost roughly two-thirds of its value. That is the real shape of the downside: growth doesn’t drift gently to the low teens as in my $909 DCF case, it can crack toward flat in a genuine ad recession, and it can do it in a single year. A concentration wrinkle sharpens this: a meaningful slice of Meta’s growth in recent years has come from China-based cross-border advertisers (the Temu/Shein-type sellers chasing Western consumers). That cohort is exposed to tariffs, the end of de-minimis import exemptions, and any Beijing–Washington trade friction, so a policy shock could remove a chunk of ad demand that has nothing to do with Meta’s execution. Pair a flat-revenue year with the ~$130 billion capex commitment and Anmuth’s negative-FCF path stops being a model and becomes arithmetic.
- 2026 capex guided to $125–145 billion, with total 2026 expenses of $162–169 billion. Depreciation is now the single largest cost driver — and it’s the part of the AI build that hits the income statement whether or not the revenue shows up. CFO Susan Li said as much when she laid out where 2026’s expense growth comes from:
Susan Li · CFO
Q4 2025 earnings call, January 2026
The majority of expense growth will be driven by infrastructure costs, which includes third-party cloud spend, higher depreciation, and higher infrastructure operating expenses.
That is the capex bet arriving as a cost. Depreciation on a build this size — $69.7 billion spent in 2025, $125–145 billion guided for 2026 — lands on the P&L on a fixed schedule; the revenue it’s meant to generate does not. The gap between those two timelines is the entire near-term risk to margins, and it’s why the FCF trough is real even as the business grows.
Worth sizing it, because “normalized FCF” only survives if the depreciation math works. In 2025 Meta’s D&A was about $22 billion (the gap between $105.4B EBITDA and $83.3B operating income), roughly 11% of sales. Now run the treadmill forward, and here is how I’m owning the ~$45–60 billion estimate rather than eyeballing it. The build is a mix of two very different lifespans: the shells, land and power infrastructure depreciate over roughly 15–30 years, but the AI servers inside them — GPUs especially — carry a useful life of only about three years before they’re obsolete. That short GPU life is the driver: at ~$130 billion of annual capex heavily weighted toward that three-year hardware, straight-line depreciation on a single year’s server spend alone runs $30–40 billion. The mechanism that pushes the steady-state figure higher is the vintage stack: once you are three years into the build, three full vintages of GPUs are depreciating simultaneously (year-1, year-2 and year-3 fleets all on the P&L at once) while the buildings’ slower depreciation layers on top. Stack those overlapping vintages and steady-state D&A settles somewhere near $45–60 billion a year, or roughly 15–20% of a $300 billion forward revenue base. That is not a one-time hit that rolls off; on a perpetual GPU-replacement cycle, maintenance capex and depreciation both stay structurally elevated. Which is the real teeth of the bear case: if Meta is on a treadmill where it must keep spending $100-billion-plus a year just to stand still, then the trough FCF isn’t a temporary dip that reverses — it’s the new floor, and the Anmuth negative-FCF path is the base case, not the tail. That reconciles directly with the reverse-DCF up top: the market’s “only 12% FCF-growth hurdle” looks easy to clear, but it’s only easy if starting free cash flow stays positive. Push FCF negative and you can’t compound 12% a year off a negative number — the entire bull framing inverts. The whole thesis, once more, lives or dies on whether the incremental revenue outruns the incremental depreciation.
- Reality Labs losses keep widening. The segment lost $19.19 billion in 2025 on just $2.21 billion of revenue, wider than 2024’s $17.73 billion loss, with 2026 guidance for losses “similar to 2025 levels” and no stated breakeven date (Meta 8-K, SEC EDGAR, 2026-01-28). That’s a ~$19 billion annual cost the ad business has to cover before a dollar reaches shareholders — a large, ongoing bet whose payoff, if any, is years out; the figure to track each year is whether the loss stabilizes or keeps widening. One thing to be careful not to double-count: the $125–145 billion capex guide and the ~$19 billion Reality Labs loss overlap, they are not two clean, separate holes. Reality Labs’ spending includes its own share of infrastructure and equipment capex, so part of that $19 billion operating loss is already inside the capex figure, and the depreciation from the AI build flows through both the capex line and the Reality Labs P&L. Add them naively and you overstate the true cash outflow; the honest way to read the drag is capex plus the operating-expense portion of the Reality Labs loss, not the two headline numbers stacked.
- The bubble Meta itself flagged. Zuckerberg conceded an AI bubble is “definitely a possibility… If we end up misspending a couple hundred billion dollars, that’s going to be very unfortunate” (Fortune, 2025-09-19). And demand is running ahead of capacity — “demands for compute resources across the company have increased even faster than our supply,” he said on the Q4 2025 call (Data Center Dynamics, 2026-01-29) — which is bullish for revenue but keeps the spending taps wide open.
- Regulation and dilution. The EU hit Meta with a €200M DMA fine over “pay or consent”; Meta won the FTC antitrust trial in November 2025 (the FTC is appealing); and SBC dilution runs at 10% of sales.
The bull and bear cases share one fulcrum: the return on the AI capex. While it earns its cost of capital, the spend is investment and the depressed FCF is temporary. The day it visibly doesn’t, that same capex is the headwind that turns a $1,229 DCF into a $469 multiple model, or worse.
Great business, uncertain price
The two costumes come off cleanly. The 3% net-income drop was a one-time non-cash tax charge already reversing in 2026. The 15% free-cash-flow drop was AI capex, investment in revenue that hasn’t landed yet. Underneath both, revenue grew 22%, operating margin held at 41%, ROIC stayed at 21% before the tax distortion, and the top line just re-accelerated to 33%. The business is not in trouble. It never was.
The price is the genuinely hard part, and I won’t pretend otherwise. A multiple model anchored to trough cash flow says $469; a growth-credited DCF says $1,229; 58 analysts split the difference near $828. That is not false precision dressed up as a target, it’s an honest range, and its width is the point.
What would change my mind? Capex that never converts to free cash flow isn’t investment, it’s destruction. If Anmuth’s path plays out and Meta runs free-cash-flow negative into 2027 while revenue growth cools toward the low teens, the trough-FCF becomes the actual FCF and the $469 model is the right one. So the number I’d re-check every quarter isn’t the ad line, which is fine. It’s the gap between operating cash flow and capex. The day that gap stops closing, the cheaper story is the true one.
What’s your read on Meta here — is the AI capex a coiled spring or a $130-billion-a-year hole? I’d genuinely like to hear the bear case against the reverse-DCF math. Find me on X or LinkedIn.
Keep reading: for a true hyperscaler running the mirror image of this capex setup, my breakdown of how the market is misreading Microsoft applies the same normalize-the-capex lens, and the rest of the Finance category runs this framework across other companies.
Data sourced from Yahoo Finance via my local analysis tooling, as of July 8, 2026, computed from Meta’s reported financial statements and cross-checked against Meta’s 8-K filings on SEC EDGAR and earnings-call transcripts. Meta’s most recent reported quarter is Q1 2026 (reported April 29, 2026); Q2 2026 reports July 29, 2026. Management quotes in this piece are verbatim from primary sources verified in prior research (SEC EDGAR 8-Ks, the Q3 2025 earnings-call transcript, and the cited press reports); an automated re-fetch of live analyst pages was unavailable at publication, so analyst price-target figures should be re-verified against a live source before acting on them. Valuation inputs (discount rate, growth) are derived from the financials and analyst estimates, not hand-picked; free cash flow is computed from the cash-flow statement, not a data-feed summary field. Figures are illustrative and may lag or contain gaps; always cross-check against Meta’s 10-K/10-Q filings before acting.