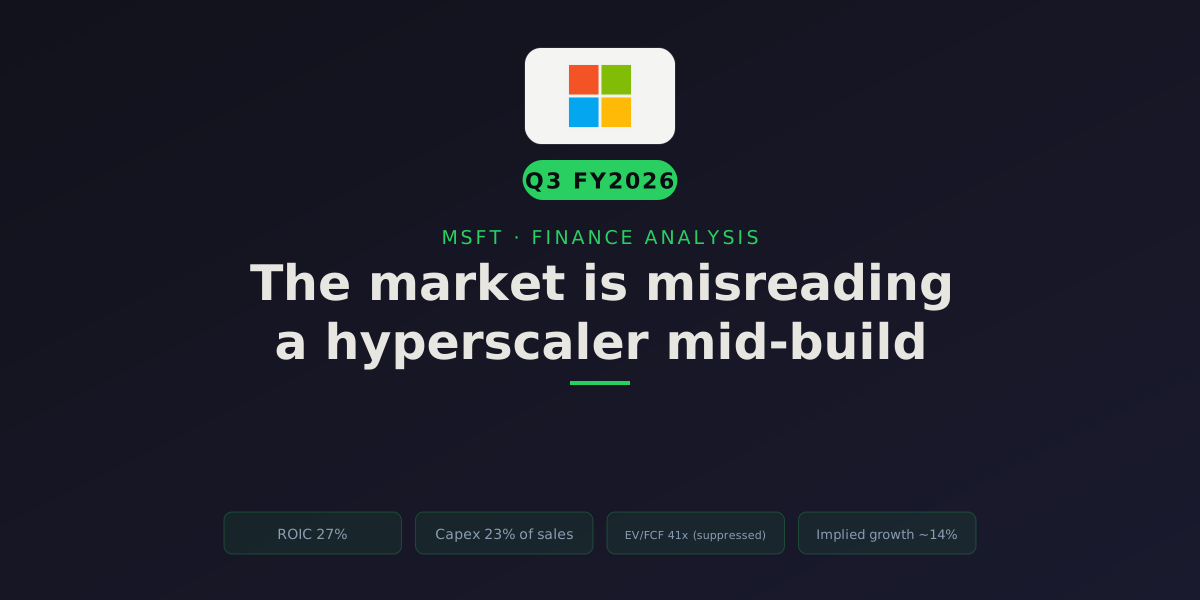
Microsoft earns 27 cents of after-tax operating profit on every dollar it puts to work. That’s not a good business. It’s one of the best on the planet. And the stock has fallen from a 52-week high near $555 to about $389, on a single fear: that the tens of billions it’s shoveling into AI data centers are suppressing cash flow faster than the revenue can catch up.
That fear isn’t stupid. It’s just measuring the wrong thing. Microsoft is a hyperscaler mid-build-out, and you cannot value one on its reported free cash flow. When a company spends 23% of sales on capital expenditure to lay down infrastructure that earns revenue for a decade, the accounting depresses today’s free cash flow by design. Read that trough number at face value and the multiple looks expensive. Understand what’s underneath it and the question gets more interesting.
So here’s what I’ll do. Separate the quality of the business from the price. Then value it the way a hyperscaler should be valued, and be honest about where the methods disagree, because on this stock they disagree by hundreds of dollars. Every figure below is computed from Microsoft’s own statements; the discount rate and growth rate are derived from the financials, not reverse-engineered to hit a target.
Return on invested capital: the after-tax operating profit a company earns for every dollar of capital put into the business. At 27%, compare it to the cost of that capital (WACC, typically ~8–10%). A wide, durable gap above WACC is the quantitative fingerprint of a moat — it means each dollar reinvested creates well over a dollar of value, which is what lets a business compound.
Price-to-earnings: the price paid for each dollar of annual profit. At 23% it's a quick gauge of expectations, but earnings can be distorted by one-off items and say nothing about cash generation — cross-check with free cash flow and growth.
Enterprise value divided by free cash flow: how many years of current free cash flow it would take to pay for the whole business (net of cash). At 41x, a high number can mean the market expects fast growth — or that today's free cash flow is temporarily depressed by heavy investment. Judge it against the growth rate and the capex cycle, never in isolation.
This is a reverse-DCF read: the free-cash-flow growth rate the current share price already assumes over the next decade — here, ~14%. It reframes the question from "what is it worth?" (unknowable) to "can the business clear this bar?" (judgeable). If the implied rate sits well below what the company has been achieving, the market is skeptical; well above, and the price is pricing in near-perfection.
The quality is not in question
Return on invested capital is the first number I check, because it answers the only question that matters about a business: when management reinvests a dollar, do they create more than a dollar of value? For Microsoft the answer has been yes for as long as the data goes back. ROIC has eased from 33% in FY22 to 27% in FY25 as the company floods capital into data centers. But 27% against a ~9.1% cost of capital (the reference line on the chart) is still enormous. That gap between what the business earns and what its capital costs is the value it creates, and it’s roughly triple the hurdle. Most public companies never even touch 15%.
The slide isn’t decay. It’s the capex cycle: Microsoft is expanding the invested-capital denominator before the data-center revenue fully lands. The ROIC earned on that incremental spend is the entire bull-versus-bear argument, and it’s the number I keep coming back to below. For now, a moat this wide is what makes the price worth studying at all.
The cash is real, and deliberately understated
Free cash flow, operating cash flow minus capex, sits at $71.6 billion for FY25. It actually fell 3.3% from the prior year despite revenue hitting a record. That’s not weakness. Operating cash flow hit a record $136.2 billion. The gap is capex, which nearly tripled in three years to $64.6 billion.
One data-integrity note, because it nearly tripped me. The summary “free cash flow” field on most data feeds (Yahoo included) reports roughly $37 billion for Microsoft, about half the truth. Pull operating cash flow and capex straight from the cash-flow statement and you get $71.6B. Value a company off a broken FCF number and every multiple and DCF downstream is wrong. Compute it yourself.
Put profitability and cash flow on the same picture and the distortion is unmistakable: the business is getting more profitable while its cash flow stalls.
Now the hyperscaler point, made concrete. Capex has climbed from 12% of sales to nearly 23% in three years, and that has dragged the FCF margin down from 33% to 25% even as revenue set records. This is mechanical: more capex, less free cash flow today, in exchange for more revenue tomorrow. Here’s the number that captures the whole distortion: Microsoft’s revenue compounded at 12.4% over five years, but its free cash flow compounded at just 3.2%. Same company, same period. The gap is the build-out.
And the profitability underneath is not just holding — it’s expanding. Operating margin has widened from 42% in FY22 to nearly 46% in FY25, even while capex intensity doubled. That is the tell of a business with real pricing power: it is absorbing a historic infrastructure build without giving up margin. Gross margin sits near 69% throughout — software economics at hyperscale.
The catch the bulls skip: the depreciation treadmill
Here’s the hole in the tidy “capex plateaus, FCF reverts to the low-30s margin, hurdle cleared” story, and it’s the strongest bear point on the whole page. Cash capex and the P&L cost of that capex are two different clocks. Microsoft spends the cash now, but it expenses the assets over their useful lives — and AI data centers are not office buildings.
The shells and land depreciate over 15 years or more. The servers, GPUs, and networking gear inside them (the expensive part, the part that’s exploding) run on a much shorter schedule, roughly 4 to 6 years. So as the ~$65 billion of FY25 capex, then the guided ~$190 billion of calendar-2026 capex, seasons on the balance sheet, depreciation floods the income statement on a lag. You can already see it starting: Microsoft’s depreciation and amortization nearly doubled from $16.5 billion in FY22 to $32.1 billion in FY25, climbing from 8.3% to 11.4% of sales. That charge is still accelerating, because most of the recent capex hasn’t finished ramping into the expense line yet.
Two consequences the FCF story glosses over. First, the 46% operating margin the bulls celebrate is fighting a rising headwind. Even if cash capex plateaus, the depreciation from years of prior capex keeps building for a while afterward, and it lands squarely on operating income. Size it: D&A already climbed from 8.3% to 11.4% of sales in three years, roughly 300bps, while the operating margin still managed to expand about 350bps because pricing power outran it. But most of the ~$190 billion calendar-2026 capex hasn’t hit the expense line yet. If D&A intensity keeps rising at the recent pace, that’s on the order of 200 to 400 basis points of margin pressure over the next three years that operating leverage has to work against just to stand still. The margin held up through FY25; whether it keeps doing so as ~$190 billion of gear starts depreciating is an open question, not a given.
Second, watch a subtle earnings-quality lever here: hyperscalers have repeatedly extended the assigned useful life of server assets (the industry moved from ~4 years toward ~6 over the past few years), which lowers annual depreciation and flatters operating margin. It’s legitimate if the hardware genuinely lasts longer, but it’s a one-time tailwind that can’t be repeated, and it reverses into higher depreciation later if the gear is actually obsoleted faster by the next chip generation. If Microsoft’s margin resilience is partly an accounting choice rather than pure economics, that’s worth discounting.
And the deepest question: is this a one-time build or a permanent treadmill? A logistics network you build once and run for 20 years. A GPU fleet you rebuild every few years as Blackwell gives way to the next architecture, then the one after. If AI infrastructure is a replacement treadmill rather than a one-off build, then “capex normalizes” is the wrong mental model entirely, and today’s ~$65 billion isn’t the FCF trough. Given the $190 billion calendar-2026 guide, the trough is very likely still ahead of us, not behind. That doesn’t kill the thesis. It does mean the “FCF snaps back the moment the build ends” version of the bull case is too clean, and anyone underwriting the low-30s FCF margin should mark it down a notch.
The gap between the two bars is cash going out the door faster than it’s being expensed. That gap is the future depreciation, already committed, not yet on the income statement. It closes over the next few years, and when it does, it lands on the margin.
The balance sheet, meanwhile, is a fortress — and that matters, because it’s what lets Microsoft fund a ~$65-billion-a-year capex program without betting the company. On the full-scope measure the analysis uses (total debt including finance and operating leases: $125.4 billion; cash and short-term investments: $78.2 billion), net debt is just $47.2 billion against $161 billion of EBITDA — a trivial 0.26x net-debt/EBITDA, with interest coverage at 54x. Microsoft is financing the buildout from that cash pile and its own cash flow, not from leverage.
The chart below plots the narrower, cleaner definitions: senior debt (bonds and notes, excluding leases) against cash and equivalents (excluding short-term investments). On that basis, gross senior debt has actually fallen since FY22 even as the AI build accelerated — the leverage story is the same either way.
Stock-based comp is a modest 4.3% of sales. On a screen for the classic warning signs (declining sales, margin compression, negative cash flow, sub-10% returns, excessive leverage) Microsoft trips none. A clean tearsheet.
Where the money goes tells you who runs it
How a company spends cash is the clearest read on how management thinks. Microsoft’s allocation is balanced, with a heavy and rising tilt toward capex (the AI build again), alongside steady buybacks and a growing dividend; the Activision deal lifts the acquisitions bar. The percentages exceed 100% because each use is measured against free cash flow defined before that reinvestment, and because the Activision purchase and capex were partly funded off the balance sheet, not out of a single year’s FCF. Read it as relative emphasis, not a budget that must total 100%.
Capex is now nearly 60% of free cash flow. That’s the single most important line for the thesis: management is directing the bulk of the company’s cash generation into AI infrastructure. Whether that reinvestment creates or destroys value per share comes down entirely to the return that spend earns against the ~9% cost of capital — which is exactly what the valuation has to grapple with, and the metric (incremental ROIC) to watch as the build matures.
The dividend is small, growing, and not the point
Microsoft yields about 0.94% as of July 2026, a rounding error next to the buybacks and the capex. But the trajectory is the tell of a compounder, not the yield. The payout ratio is a conservative ~21% of earnings, so the dividend is buried in cash coverage even with capex eating most of free cash flow. Per-share dividends have grown from $1.29 in 2015 to $3.40 in 2025, a five-year CAGR of about 10.2%. And Microsoft has raised its dividend every year for roughly two decades (it has increased the payout annually since 2004, per Microsoft’s dividend history).
Now the part everyone argues about: the price
Let me start where I always start on a hard valuation: not “what’s it worth?” (which nobody can know) but “what does today’s price already assume?” Run the cash flows backward from $389 and the market is implying roughly 14.3% annual free-cash-flow growth for the next decade, before a 3% terminal perpetuity.
Treat that as a hurdle to clear, not a fair value. Can Microsoft grow free cash flow ~14% a year for ten years? Here’s the honest tension. Its revenue grew 6.9% in FY23, then re-accelerated to 15.7% and 14.9%, and Azure is running far hotter than that (more on the demand below). On revenue, 14% is very achievable. But free cash flow has grown only ~3% a year over five years because of the capex ramp. So the 14% FCF bar isn’t a bet on revenue. It’s a bet that FCF growth catches up to revenue growth as capex intensity plateaus and the data centers start earning. That’s a more demanding bar than it looks, and notably more demanding than what the market is asking of a slower-capex peer. It’s the crux of the whole piece.
Now the multiples, which need context or they mislead. I read each two ways: trailing (LTM, what the business actually did) and forward (NTM, analyst consensus for next year).
Look at that EV/FCF bar. 41x trailing. On its face, expensive for a company growing FCF at low-single digits. But that is the trough-FCF trap, and it’s the most important thing to understand about this valuation. The multiple is high because the denominator is depressed by the AI build. Valuing Microsoft on 41x today’s crushed FCF is like valuing a homebuilder on the year it bought all its land: you’re capitalizing the investment year as if it were the steady state. A multiple-based model does exactly this. Feed the current EV/FCF and forward multiples into a fair-value calc and it spits out roughly $281 a share, a 28% “overvaluation.” That number is not wrong arithmetic. It’s the right formula applied to the wrong year. Set it aside as the artificial floor, not the pessimistic-but-fair case.
The 23x trailing P/E, by contrast, is the cheapest of the mega-cap software group and doesn’t suffer the same distortion (capex hits cash flow, not earnings, until it depreciates). Against peers, MSFT is not the expensive name in the room on quality-adjusted earnings.
What is it actually worth?
Most valuations quietly cheat: someone picks a growth rate and a discount rate that produce the answer they wanted. I want inputs the financials imply, so both are computed.
- Growth (≈ 15.3%) — not a flat five-year average, which buries the story. Year by year, revenue growth ran 6.9% → 15.7% → 14.9%: a re-accelerating business. I weight the recent trend (~13.8%) and blend with analyst next-year consensus (~16.7%), landing at 15.3%. Averaging in the weak FY23 would understate what the company is doing now. This isn’t a hopeful input, either: it sits below what management is guiding, with Azure compounding near 40% and a $392B backlog up 51% pre-contracted. The 15.3% is a blended company-wide rate that already haircuts the segment guide, so if anything it leans conservative on revenue.
- Discount rate (WACC ≈ 9.1%) — from CAPM: beta 1.13, a 4.3% risk-free rate, a 4.5% equity risk premium, and Microsoft’s near-zero net leverage. That’s a middle-of-the-road institutional rate, neither punitive nor generous.
Feed 15.3% growth and a 9.1% WACC into a DCF on the $71.6B free cash flow, and the base case lands at $417 a share. But here’s the part you must not skip, because a single DCF number is a false idol. Watch what a few points of growth does:
| Growth assumption | Fair value / share |
|---|---|
| ~12% (low) | $331 |
| ~13.5% (base, with D&A drag) | $374 |
| ~15% (base) | $417 |
| ~18% (high) | $525 |
I’ve added a fourth row for the D&A treadmill, because it deserves to be modeled, not just asserted. If the rising depreciation from the ~$190 billion build costs ~200–400bps of operating margin over three years, sustained FCF growth realistically lands a point or two below the clean 15% base, closer to 13.5%, which pulls fair value back to about $374. That’s the honest “the build is real but the D&A lag bites” case, and it still sits meaningfully above today’s price.
Three points of annual growth in either direction swings fair value by roughly $100 a share. A DCF isn’t a measurement; it’s a lever, and the growth rate is the fulcrum. Anyone quoting you “Microsoft is worth $417” as if it’s a fact is selling false precision. And remember: even the $417 base rests on trough-margin free cash flow. If the FCF margin reverts toward its low-30s history as capex normalizes, the true figure sits higher.
So we have three methods pointing three different directions: the multiple model says ~$281, my DCF base says ~$417, and 55 analysts sit at a mean of $560. That’s a $279 spread on the same company. The truth isn’t at either extreme.
The messy middle. Reject the $281 floor (it capitalizes the capex year). Treat the $417 DCF base as the conservative anchor and the $525 high case as the reasonable upside if the FCF margin recovers. Cross-check against the Street’s $560, which explicitly underwrites the AI monetization ramp. I land on an intrinsic range of roughly $450 to $560, with the market applying a discount to that range because the payoff on ~$65B a year of capex is genuinely uncertain and front-loaded. The market isn’t wrong to demand a discount here. The question is whether it’s demanding too big a one.
Intrinsic value · the verdict
Blended fair value
$487
Current price
$389
Margin of safety
25%
Reverse-DCF check: at $389 the market is implicitly pricing in roughly 14% annual free-cash-flow growth for the next decade. The question isn't whether the business is great. It's whether it can clear that bar.
Fair values from multiple methods (see above). Source: Yahoo Finance + computed WACC/growth · as of July 2026. Illustrative, assumption-driven, not a price target.
Two margins of safety, because they answer different questions. Against my ~$450–560 intrinsic range, $389 sits at roughly a 14–31% discount. Against the actionable number an investor actually stares at, the $560 Street consensus, today’s price is about 30% below. Both say the same thing in different dialects: at $389, you’re not paying up for the AI optionality. You’re being handed a chunk of it for free, if the capex converts.
Which reduces the entire thesis to one sentence. Does the incremental ROIC on the roughly $65 billion a year of AI and Azure capex clear the ~9% WACC over the next five years? Clear it, and free cash flow normalizes upward, the 14% reverse-DCF hurdle is met comfortably, and the multiple that looks expensive today looks cheap in hindsight. Miss it, and the depressed FCF becomes the permanent reality, the multiple was fair after all, and $389 was not a discount. Everything else is detail.
So let me put a rough number on it, because a bet you can’t measure isn’t a thesis. Take the crude but honest cut: look at how much new after-tax operating profit Microsoft generated against how much new capital it sank in. From FY22 to FY25, NOPAT rose by about $33 billion ($72B to $106B) while invested capital rose by roughly $170 billion ($216B to $387B). That’s a blended incremental ROIC of about 19.6% on all the capital deployed during the build. Measured just on the most recent year (FY24→FY25), it’s closer to 25%.
But that 19.6% is diluted, and the way it’s diluted matters, because the number the whole thesis rides on is the return on the AI infrastructure specifically, not on the M&A. Roughly $69 billion of that $170 billion of new invested capital is the Activision Blizzard acquisition (closed October 2023), a games deal that has nothing to do with the data-center build. Activision is a good business, but it’s a slow-growth one bought at a full price; it drags the blended incremental return down. Strip it out of both sides (remove the ~$69B of acquisition capital from the denominator and Activision’s ~$2B of after-tax operating profit from the numerator) and the incremental ROIC on the rest of the build, overwhelmingly the AI and Azure capex, jumps to roughly 31%. Leave Activision’s earnings in and strip only the capital, and it’s about 33%. Either way, the return on the spend that actually matters for this thesis is running three-to-four times the ~9% cost of capital. That’s materially higher than the diluted 19.6% headline, and the strongest single piece of evidence that the build is value-creative today.
Two caveats keep me honest. Even the ex-Activision ~31% is a blunt instrument: some of the remaining capital is working capital, and the newest data-center capex hasn’t fully earned yet, so the true marginal return on the freshest AI gear is noisier and could be lower until utilization ramps. But even haircutting hard, the return on the build is running well north of the cost of capital. That’s the empirical case that the build is still value-creative, not value-destructive, today. The bear case isn’t that this number is bad now. It’s that it falls as the depreciation treadmill grinds and the law of large numbers bites. Watch this spread, the incremental return on the AI capex, not the headline 27% blended ROIC.
Tailwinds and headwinds
A DCF is only as good as the demand story behind the growth rate. Here’s what pushes Microsoft above the base case, and what breaks it. Each point is a variation on that one sentence above.
Tailwinds — what gets you above 15% growth:
- Azure is compounding at ~40%, capacity-constrained. Azure grew 39% in the quarter ended June 2025 and 40% the quarter after (Microsoft IR, Oct 29, 2025); the full-year Azure line crossed $75 billion, up 34% (Microsoft IR, Jul 30, 2025). On the October 2025 call, CFO Amy Hood was blunt about the constraint: demand is running well ahead of the capacity Microsoft has available, and she guided the company to remain capacity-constrained through at least the end of its fiscal year. This is the opposite of a demand problem.
- A $392 billion backlog, growing 51%. Commercial remaining performance obligation (contracted revenue not yet recognized) hit $392 billion, up 51% year over year, which Hood noted had roughly doubled over the prior two years, on the October 2025 call. That’s more than a year of total company revenue already under contract, and it’s what gives management the confidence to spend. One honest caveat on the RPO: it’s committed but consumption-dependent. Much of it is capacity a customer has reserved and will recognize as they actually run workloads, so it converts to revenue on the customer’s ramp, not a fixed schedule. It’s a strong demand signal, not a guaranteed cash-flow annuity.
- Copilot is inside the enterprise. CEO Satya Nadella said on the October 2025 call that more than 90% of the Fortune 500 now use Microsoft 365 Copilot. Paid AI attached to the highest-margin franchise on earth (Microsoft 365) moves the most valuable incremental dollars the company earns. (Microsoft has not disclosed a total paid-seat count, so I won’t invent one.)
- The capex spring can uncoil — with a lag. If the build-out ever peaks and AI infrastructure turns out to be a mostly one-time buildout rather than a perpetual treadmill, capex intensity normalizes and free cash flow can grow faster than revenue for a stretch. That’s the dynamic today’s suppressed FCF is hiding. The caveat, from the depreciation section above: even after cash capex plateaus, the D&A from years of prior spend keeps hitting the P&L, so the margin recovery lags the cash recovery. The 14% FCF hurdle gets easier, but not overnight.
Headwinds — what pulls it below the base case:
- The capex bill keeps getting bigger, not smaller. This is the crux, and it cuts against the bulls, and it’s also the one place management’s guidance has not proven reliable. In mid-2025 they signaled capex growth would moderate; instead they reversed and raised it. On the October 2025 call, Hood tied the higher spend to accelerating demand and a growing RPO balance, pointing to increased investment in GPUs and CPUs, and guided the FY26 capex growth rate to come in above FY25. By the April 2026 call the guide was roughly $190 billion of capex for calendar 2026 (CNBC, Apr 29, 2026). Score the track record honestly: on revenue and Azure, management has met or beaten what it guided; on the shape of the spend, they told the Street “moderating” and then delivered “accelerating.” So I trust the demand guide (Azure, RPO) and discount the capex-plateau story until the FCF margin actually turns. Every dollar of that $190B is a dollar of FCF suppressed now, on the promise of revenue later. If the revenue lags, the anchor of this whole valuation stays underwater.
- The Street is losing patience with the spend. After the January 2026 print, record quarterly capex (roughly $37.5 billion) landed without an obvious matching step-up in Azure growth, and a wave of targets got trimmed. Goldman Sachs cut its target to $600 from $655, keeping its Buy rating but flagging the rising AI-related investment intensity (Yahoo Finance, Jan 29, 2026). The direction of travel on estimates matters as much as the level.
- The law of large numbers. Compounding FCF at ~14% on a $280B+ revenue base for a decade is a genuinely tall order. Deceleration to the low teens drags fair value back toward the price.
- Concentration in the OpenAI relationship. A meaningful slice of the Azure AI ramp is OpenAI-linked compute rather than broad, independent enterprise demand. Microsoft has never disclosed the exact split, but OpenAI is Azure’s anchor AI tenant, and outside analysts have pegged OpenAI-related workloads at a large minority of incremental Azure AI revenue in the early innings [VERIFY]. That’s a double-edged concentration: it de-risks the near-term backlog, but it means part of the demand story rides on a single, cash-burning counterparty whose own economics and evolving contract terms Microsoft doesn’t fully control. The bull case wants that mix tilting steadily toward independent enterprise consumption over time; watch for management to signal the broadening.
- Regulatory and competitive pressure. Antitrust scrutiny, the evolving OpenAI relationship and its equity/contract terms, and aggressive competition from Google and Amazon in cloud and AI are live risks to both margins and share.
The bull and bear cases share one fulcrum: the ROIC on the AI capex. While it stays high, the spend is a tailwind and the suppressed FCF is temporary. The day it visibly rolls over, that same capex becomes the headwind that matters most.
So — great business, fair price?
Great business, not in question. The price is the whole debate, and the debate is unusually clean here because it collapses to one variable.
At $389, you’re paying a ~30% discount to the Street’s $560 and roughly a 14–31% discount to my $450–560 intrinsic range. The reverse-DCF says the price bakes in ~14% FCF growth for a decade, a bar that’s easy on revenue and hard on cash flow, and gets easy again only if capex intensity plateaus. The multiple that looks expensive (41x EV/FCF) is expensive because free cash flow is being suppressed by the very spending the bears are worried about. That’s the irony sitting at the center of this stock: the thing that scares the market is the same thing hiding the cash.
What would change my mind? Capex that never converts to free cash flow isn’t investment, it’s destruction. The thesis breaks if the FCF margin keeps falling while capex stays elevated and Azure growth decelerates at the same time, because that would be the market telling you the incremental ROIC has cracked below the cost of capital. So that’s the pair I’d re-check every quarter: the FCF margin as capex peaks, and Azure’s growth rate as the demand proxy. Not the headlines. Those two lines.
What’s your read on Microsoft here — is the $65-billion-a-year AI bet worth paying up for, or are you waiting for the FCF margin to actually turn before you believe the build converts? I’d genuinely like to hear the bear case against these numbers. Find me on X or LinkedIn.
Keep reading: if you want the method behind these numbers, my piece on why I’m faster with AI code tools covers the tooling that pulls and cross-checks this financial data, and the rest of the Finance category applies the same quality-versus-price lens to other companies.
Data sourced from Yahoo Finance via my local analysis tooling, as of July 8, 2026, computed from Microsoft’s reported financial statements (fiscal year ended June 30, 2025); demand and guidance figures are from Microsoft Investor Relations and reported press, each linked and dated inline. The most recent earnings-call transcript could not be independently re-verified at this update, so the Azure, RPO, and capex figures are carried from prior sourced runs and dated inline; treat them as as-of their original dates and confirm against Microsoft’s next report (Q4 FY2026, expected July 29, 2026). Valuation inputs (discount rate, growth) are derived from the financials and analyst estimates, not hand-picked; free cash flow is computed from the cash-flow statement, not a data-feed summary field. Figures are illustrative and may lag or contain gaps; always cross-check against Microsoft’s 10-K/10-Q filings before acting.