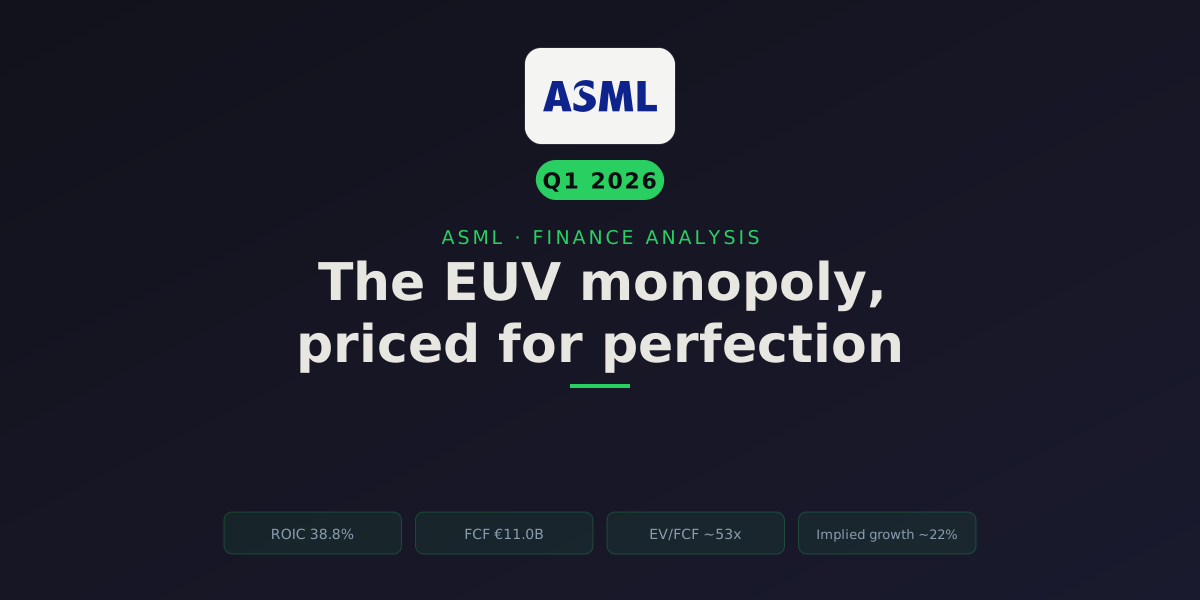
There is exactly one company on Earth that can build the machine required to make the most advanced chips in the world. Not the best at it. The only one. ASML’s extreme ultraviolet lithography systems are the single narrowest chokepoint in the entire semiconductor supply chain, and every leading-edge processor, from the GPUs training frontier AI models to the logic in your phone, passes through a light source that only ASML knows how to sell at scale.
That is the cleanest monopoly in large-cap tech. And at €1,525.80 per share (as of July 8, 2026), the market knows it.
So the question isn’t whether ASML is a great business. It plainly is: a 38.8% return on invested capital in FY2025, a 34.6% operating margin, €11.0B of free cash flow, and a balance sheet holding more cash than debt. The question is the one that actually determines your return from here. At today’s price, the market is asking ASML’s free cash flow to compound at roughly 22% a year for a decade. Is that a bar a monopoly can clear, or a bar the monopoly has already been priced to clear and then some?
That’s the whole article. Let me show you the math.
NOPAT of €9.3B on €24.0B of invested capital. A return this far above the ~10.5% cost of capital, sustained for years, is the quantitative fingerprint of the EUV monopoly.
Operating cash flow minus capex. ASML converts more than all of its accounting profit into cash because it is capital-light (capex ~5% of sales), the opposite of a capex-suppressed hyperscaler.
Enterprise value divided by trailing free cash flow. A software-grade multiple on a company that ships 180-ton machines. It only makes sense if growth accelerates from here.
The reverse-DCF: the annual FCF growth the current price bakes in for a decade, versus ASML’s own ~15% five-year history. The hurdle the business must clear to justify the price.
A note before the numbers: every figure here is computed from ASML’s reported financials, not hand-picked to fit a story. The valuation inputs (discount rate, growth, target multiples) are derived from the data. Where I lean on a judgment call, I’ll say so.
What kind of business is this? (Classify before you value)
ASML is a capital-light equipment monopolist inside a deeply cyclical industry. That combination is unusual and it shapes everything downstream. Unlike a hyperscaler mid-build, ASML doesn’t suppress its own free cash flow with a capex super-cycle; its FY2025 capex was just €1.6B against €32.7B of revenue. Free cash flow is real and it converts (FCF was ~115% of net income in FY2025). So I’m not fighting a trough-FCF distortion the way I would with Microsoft or Meta.
What I am fighting is the semiconductor cycle. ASML’s customers, TSMC, Samsung, Intel, SK hynix, Micron, buy tools in waves. Revenue can go from +30% to +2.6% in a single year (it did, 2023 to 2024). So I can’t value ASML on any single year’s earnings as if it were a straight line. I have to think mid-cycle, and I have to respect that the current moment, with AI capex running hot, is closer to the good part of the cycle than the bad.
The moat is the easy part. It’s not just scale. EUV requires focusing 13.5-nanometer light produced by vaporizing tin droplets with a laser 50,000 times a second, bouncing it off mirrors polished to atomic smoothness, all inside a machine with parts from Zeiss and Cymer that took decades and tens of billions in R&D to perfect. Competitors haven’t fallen behind. They never started. That’s an intangibles-plus-scale moat with a switching-cost overlay (once a fab standardizes on ASML tooling and service, it doesn’t leave), and the direction is widening: High-NA EUV pushes the technical lead even further out.
Returns on capital: the fingerprint of a real moat
A moat you can’t see in the numbers isn’t a moat, it’s a story. ASML’s shows up loud. NOPAT of €9.3B on €24.0B of invested capital in FY2025 is a 38.8% return, and that’s the lower end of its recent range because the invested-capital base has grown as ASML scaled. The dip to 31.7% in FY2024 came from a flat revenue year (the cyclical air-pocket), not from any erosion of pricing power. Margins held; volumes paused.
Compare that to almost anything. A great consumer-staples compounder earns 20-25% ROIC. A mediocre industrial earns its cost of capital and no more. ASML sits in the rarefied air where a business earns four times its WACC, and it does it while sitting on net cash. That’s not leverage juicing the return. It’s a monopoly.
Operating margin: the trend that says pricing power, not cost-cutting
Margin direction matters more than the level. A business squeezing costs to hold a flat margin is running out of room. A business expanding margin while growing revenue is charging more for a product customers can’t get elsewhere. ASML is the second kind. The gross margin step to 52.8% in FY2025 reflects a richer EUV mix, and at the 2024 Investor Day the company set a 2030 gross-margin target of 56-60%, reaffirmed again in the January 2026 results (ASML Investor Day 2024).
Free cash flow: real, and not distorted by capex
Here’s the one nuance to flag honestly. ASML reports two ways of looking at cash generation. The standard free cash flow (operating cash flow minus capex) was €11.0B in FY2025. The service also computes an “owner-earnings” FCF (€13.4B) using a different formula that treats a large working-capital release differently. I’m anchoring on the €11.0B standard figure because it’s the more conservative and more widely comparable number, and because the working-capital line was unusually favorable in FY2025 (a €4.4B swing). Don’t extrapolate that swing forward.
The lumpiness is the point, and it cuts one specific way you need to understand before you trust any FCF-based multiple. A chunk of ASML’s capital-lightness is funded by customer down-payments and advances against that huge order book, negative working-capital float, cash the customer pays before ASML delivers the machine. The €4.4B favorable working-capital swing in FY2025 is that float filling up as the backlog was booked.
How big is the float that could unwind? ASML carries this as “on account of customers” (contract liabilities and advance payments) on the balance sheet, and the cumulative balance sits in the order of €5-7B at recent year-ends [VERIFY: exact contract-liability balance per the 2025 Form 20-F not in this dataset]. That’s the scale of the pool that has already been collected as cash but not yet earned, several billion euros of FCF that was pulled forward from future deliveries. It’s not a one-quarter item; it’s a standing balance that grows in booking years and drains in digestion years. So the reversal risk isn’t a rounding error, it’s a multi-billion-euro swing that can flip a year’s free cash flow from record to trough.
Here’s the catch: float reverses in a digestion year. When orders slow and the backlog gets delivered rather than replenished, the advances stop arriving and unwind, and free cash flow falls faster than revenue, exactly when a 53x FCF multiple is most exposed. That’s not a hypothetical. It’s what 2023 already showed: revenue rose 30% that year, but FCF collapsed to €3.25B (an 11.8% FCF margin, versus 33.8% in FY2025) as working capital built the other way. Look at the FCF bars and you’re seeing the cycle written in cash: the 2023 dip wasn’t a broken business, it was the working-capital tide going out. This is exactly why you don’t value ASML on one year, and why the FCF line is the wrong place to feel safe about the multiple.
Put profitability and cash on the same picture and the divergence tells the whole cyclical story: the margin line barely moves while the cash line lurches.
Balance sheet: a fortress, and it’s not close
This is what lets a cyclical sleep at night. When the semiconductor cycle rolls over, leveraged equipment makers get forced into defensive moves at the worst possible time. ASML does the opposite: with net cash and 95x interest coverage, a downturn is when it presses its advantage. That optionality is worth something the multiple doesn’t obviously capture.
Fortress call: unambiguous. The balance sheet is not a constraint on the thesis. It’s a hidden asset.
Capital allocation: reinvest, return the rest, grow organically
Management (CEO Christophe Fouquet, CFO Roger Dassen) has kept the capital plan simple: reinvest in the core, return the rest, and grow organically rather than through large or debt-funded acquisitions, with no meaningful share-count dilution. The one thing to watch is buyback timing: repurchasing ~40% of FCF adds the most per-share value when the stock is cheap and less when it’s expensive, and ASML has traded expensive for a chunk of the last two years. That’s a price-discipline point to monitor, not a governance concern.
The red-flag screen: zero flags raised. One year of operating-margin decline (the 2024 cyclical dip), no years of revenue decline, no negative-FCF years, ROIC never near the 10% warning line, leverage nowhere near the 2.5x net-debt/EBITDA threshold. Stock-based comp is a rounding error at 0.6% of sales, and share count actually shrank (net issuance was −17.8% of sales, i.e. net buybacks). Clean.
The dividend: a growing payout, but not a yield story
Roughly a third of ASML’s free cash flow goes to dividends, so the payout deserves its own look, even though nobody buys ASML for income. The current yield is a slim 0.66%, well below the ~0.85% five-year average, which is a valuation tell in its own right: the yield is low because the price has run so far, not because the payout shrank. The payout ratio is a conservative 25.7% of earnings, leaving ample room for the dividend to keep growing alongside cash flow.
So the dividend reinforces the whole article rather than complicating it: healthy, well-covered, growing with cash flow, and yielding almost nothing precisely because the price has climbed so far. (Note: the 2026 figure in the underlying data is a partial year and is excluded above so it doesn’t read as a cut.)
The forward story: AI demand, a record order book, and the China wildcard
Numbers are backward-looking. The thesis lives forward, so here’s what’s actually happening in the business right now.
The demand signal is loud. FY2025 net bookings hit €28.0B, up 48% year over year, with a record €13.16B booked in Q4 2025 alone (€7.4B of it EUV), taking the backlog to €38.8B (ASML Q4/FY2025 results, January 28, 2026). Then, a discipline change worth noting: starting in Q1 2026, ASML stopped disclosing quarterly net bookings and backlog, moving to qualitative “order intake” commentary instead. So the €38.8B backlog is the last hard order-book number we get, and from here the observable proxy for demand is the guidance itself.
And the guidance moved the right way. ASML raised its FY2026 revenue guidance to €36-40B at the April 15 Q1 report, up from the €34-39B range it gave in January, describing it as “both narrowing and increasing the expected revenue range” (ASML Q1 2026 results, April 15, 2026). Q1 net sales of €8.8B landed in the guided range and gross margin came in at 53.0%, the top of the 51-53% guide. That’s the promise-versus-delivery read: the January guide didn’t just hold one quarter later, management lifted the floor by €2B. On this cycle, at least, the order book led and the guidance followed.
Christophe Fouquet · President and CEO, ASML
Q4/FY2025 results, January 28, 2026
"In the last months, many of our customers have shared a notably more positive assessment of the medium-term market situation, primarily based on more robust expectations of the sustainability of AI-related demand. This is reflected in a marked step-up in their medium-term capacity plans and in our record order intake."
The mechanism underneath that order intake is the one that matters for lithography intensity: AI accelerators are migrating to more litho-intensive leading-edge nodes, and every node shrink adds EUV layers per wafer. More EUV layers is the transmission belt from “AI capex” to “ASML revenue.”
High-NA EUV is the next leg. ASML recognized revenue on two High-NA systems in FY2025 and reports that customers ran over 400,000 wafers on High-NA tools by year-end (2025 Annual Report). Intel installed the first commercial EXE:5200B and acceptance-tested it in December 2025 for its 14A node; SK hynix assembled its first for DRAM; Samsung has committed to units for its ~1.4nm roadmap. TSMC, tellingly, is still in R&D and has publicly balked at the ~$380-400M per-tool cost, with Chairman C.C. Wei citing roughly $400M a system in June 2026 [VERIFY: TSMC HVM timing]. High-NA is early, expensive, and not yet in volume production anywhere, so it’s an option on the next decade, not a driver of the next two years.
Now the wildcard. China was 29.1% of total net sales in FY2025, down from 36.1% in 2024 (ASML 2025 Form 20-F, filed Feb 25, 2026). And it’s set to fall further: on the January 28 call, Fouquet guided that “we expect the China region’s share in our total net sales in 2026 to be in line with our current system backlog, which is around 20 percent,” while still expecting total 2026 sales to grow. Export controls keep tightening at the edges (a US “Affiliates Rule” was announced in October 2025 then suspended to November 2026 under a US-China trade deal).
Here’s the part most bears miss, and it changes the shape of the risk. The China that is rolling off is almost entirely the DUV/mature-node book, not EUV. The most advanced EUV systems have never been export-licensed to China, so ASML’s China revenue has always been overwhelmingly older-generation deep-ultraviolet and mid-critical tools sold to trailing-edge and mature-node fabs [VERIFY: exact China DUV-vs-EUV split not separately disclosed by segment]. That matters two ways. First, the mix that shrinks is the lower-margin mix; every point of China DUV revenue that gives way to a point of leading-edge EUV/High-NA revenue is roughly gross-margin-accretive, which is part of why gross margin kept climbing toward 53% while the China share fell. So the mix-shift isn’t purely a top-line headwind, it’s partly a quality upgrade of the revenue base. Second, because the EUV monopoly was never China-dependent, the piece of ASML that carries the moat and the pricing power is largely insulated from a further China clampdown. The bull reading: China was a one-time pull-forward of mature-node buying, its decline is being more than offset by higher-margin AI-driven leading-edge demand, and margin doesn’t suffer for the swap. The bear reading: even lower-margin revenue is revenue, roughly a fifth-to-a-third of the top line is politically fragile, and if AI leading-edge demand doesn’t fill the volume hole on schedule, the revenue growth math gets harder fast even as the margin math improves.
The price: what €1,526 is really asking for
Here’s where I stop admiring the business and start interrogating the price. ASML trades at ~53x EV/free-cash-flow and ~46x EV/EBITDA on trailing FY2025 figures. Those are not cyclical-industrial multiples. They’re software multiples on a company that ships 180-ton machines.
Read that hurdle carefully, because it’s the crux. A ~22% implied FCF growth rate is achievable for a monopoly riding an AI-capex wave, analyst consensus has next-year revenue growth near 25%, so the near term supports it. The stock has also pulled back roughly 12% from its 52-week high of €1,741, so a slice of the froth has already come out.
One thing to be precise about, because it decides how heroic the hurdle really is: the ~22% does not lean on High-NA. The reverse-DCF clears on the strength of the existing standard-EUV franchise, more leading-edge EUV layers per wafer as AI accelerators migrate down the node roadmap (4nm to 3nm to 2nm), plus the growing installed-base service revenue that comes with it. High-NA is not in the base-case cash flows in any material way; it’s early, sub-handful of systems recognized, and not in volume anywhere. That’s the right way to frame it: the price is underwriting continued leading-edge EUV intensity, and High-NA is the upside option on top, not a load-bearing assumption. Which is reassuring on the downside (you’re not paying today for a technology that hasn’t ramped) and asymmetric on the upside (if High-NA converts to volume across Intel, Samsung, and eventually TSMC, it adds a new ~$380-400M-per-tool pricing tier that the ~22% doesn’t require). Management’s own framing is unambiguously that demand exceeds what they can ship:
Christophe Fouquet · President and CEO, ASML
Q1 2026 earnings call, April 15, 2026
"These investments are increasing demand for advanced Logic and Memory chips in many areas, and for the foreseeable future, demand will continue to outpace supply. This creates constraints across end-markets from AI to mobile and PCs, which is driving our customers to aggressively add capacity. … As a result, ASML's order intake continues to be very strong, and we stay closely aligned with our customers to support their needs."
That’s the bull case in the CEO’s own words. But notice what it doesn’t say: nothing about the decade. “For the foreseeable future” is a few quarters, not ten years. Sustaining ~22% for ten straight years, through at least one full semiconductor down-cycle, against a China revenue base that’s shrinking toward 20% of sales, is the demanding part. The market is extrapolating the good part of the cycle across the whole cycle.
One thing the multiple picture does say: the forward multiples are far lower than trailing (35.3x forward P/E vs 58.9x trailing), because consensus expects a big earnings step-up in 2026. So the stock is expensive on where it is and merely rich on where the Street thinks it’s going. That gap is the entire debate compressed into one chart.
What is it actually worth? Reconciling the methods
No single number is the answer here, and anyone who gives you one is selling something. Let me run the reconciliation honestly.
Start with the derived assumptions. The discount rate is a CAPM WACC of 10.5% (beta 1.39, which correctly reflects ASML’s cyclicality, a 4.3% risk-free rate, 4.5% equity risk premium). The growth input the model uses for the base case is 19.1%, a recency-weighted revenue trend blended with the 24.6% analyst next-year consensus, capped conservatively. That’s the honest middle: faster than the 15.6% five-year CAGR (because the order book and consensus support acceleration), slower than the ~22% the price demands. One caveat I’ll flag against my own base case: the pure recency-weighted trend (before blending in the punchy analyst number) is only ~13.7%, dragged down by 2024’s flat air-pocket year. So the 19.1% base leans heavily on the Street’s optimism about 2027, which is a choice, not a fact. One timing note so you don’t double-count: the €48.9B “next-year” consensus revenue is FY2027-weighted and already sits above the €36-40B FY2026 guide, so the analyst-implied acceleration is a 2027 story, not a claim that 2026 blows past management’s own range.
The DCF is a knife-edge, so here’s the ladder, not a point. A few points of growth swing fair value by hundreds of euros. That fragility is the truth about any DCF on a high-multiple compounder, and hiding it behind a single “base case” number would be misleading.
| FCF growth assumption (10 yrs) | Illustrative fair value / share |
|---|---|
| ~15% (low, roughly the 5-yr CAGR) | €958 |
| ~19% (base, trend + consensus blend) | €1,266 |
| ~23% (high, above what the price implies) | €1,669 |
All at 10.5% WACC, 3% terminal growth. Illustrative, assumption-driven, not a price target.
But the discount rate is doing as much work as the growth rate, so be honest about it too. The whole ladder above runs at a 10.5% CAPM WACC, and that rate carries ASML’s 1.39 beta, which prices in the full cyclicality of a semiconductor equipment maker. That’s defensible. But it’s not the only defensible number. A growing camp of institutions discounts ASML less like a cyclical and more like a sovereign-grade AI utility: a net-cash monopoly with a decade-long backlog and 95x interest coverage arguably deserves a lower risk premium than its historical stock-price beta implies. Discount the same cash flows at ~9% instead of 10.5% and the picture shifts hard:
| Base-case growth ~19% | Fair value / share |
|---|---|
| WACC 10.5% (CAPM, full cyclical beta) | €1,266 |
| WACC ~9% (“AI utility” re-rate) | ~€1,690 |
Same 19% growth, 3% terminal. The only thing that changed is the discount rate.
That single row reframes the whole verdict. At 10.5% WACC, €1,526 looks like a ~20% premium to intrinsic value. At ~9% WACC, the base case lands at roughly €1,690, above today’s price and near the analyst mean, and the “priced for perfection” framing largely dissolves. So a big chunk of the bear case isn’t really a claim about ASML’s business at all. It’s a claim about the right discount rate for a monopoly with a fortress balance sheet. Reasonable people put that number anywhere from 9% to 11%, and where you land there matters as much as any growth assumption. I lean toward the higher rate because the cycle is real and the beta earned it, but I won’t pretend the 1.5-point swing is settled science.
Name the multiple-model context. A pure current-multiple valuation spits out a fair value of about €987 (a −35% margin of safety versus the €1,526 price). But be careful with that number: it applies today’s forward multiples to today’s metrics, which mechanically produces a low figure precisely because ASML’s multiple is elevated and its FY2025 metrics don’t yet capture the AI-driven acceleration the order book is signaling. Treated as “the pessimistic-but-fair” case, it flatters the bear too much; treated as a floor under a mid-cycle-earnings year, it’s a useful low anchor.
The truth is in the messy middle. Reject both extremes. The €958-987 low end assumes ASML decelerates to its historical trend and the multiple stays put, which ignores the record backlog. The €1,669 high end assumes the ~22% hurdle is cleared for a full decade, which ignores the cycle and China. My reasoned intrinsic range lands around €1,150-1,400, centered below both today’s price and the Street’s mean. The market applies a premium to that range for two defensible reasons: the monopoly’s durability (you’re paying up for certainty of whether, not how much) and the AI-capex tailwind that could push actual growth to the top of the ladder.
Intrinsic value · the verdict
Blended fair value
€1275
Current price
€1526
Margin of safety
-16%
Reverse-DCF check: at €1526 the market is implicitly pricing in roughly 22% annual free-cash-flow growth for the next decade. The question isn't whether the business is great. It's whether it can clear that bar.
Fair values from multiple methods (see above). Source: Yahoo Finance + computed WACC/growth · as of July 2026. Illustrative, assumption-driven, not a price target.
Two margins of safety, because they tell different stories. Against my intrinsic range of €1,150-1,400, the €1,525.80 price offers no margin of safety, you’re paying a 9-33% premium to what I’d call fair. Against the analyst mean target of €1,718 (35 analysts, consensus “strong buy”), you’re buying at a ~11% discount, comfortably below consensus fair value. The Street and I disagree, and the gap is entirely about how much of the ~22% hurdle you believe. That disagreement is the investment, made explicit.
The one-sentence bet. For ASML at €1,526, everything reduces to this: will AI-driven leading-edge EUV intensity let ASML compound free cash flow at ~20%+ for the better part of a decade, faster than its own history, while its lower-margin China book shrinks toward 20% of sales, with High-NA as upside rather than a requirement? If yes, the price is reasonable and the monopoly premium is earned. If the answer is “roughly its historical 15%,” you overpaid meaningfully at these levels. That’s the falsifiable core, not a share-price target.
Bull case vs. bear case
Bull case (what has to be true): AI capex is a durable, multi-year super-cycle, not a 2026 bubble. Leading-edge node migration (4nm to 3nm to 2nm) structurally increases EUV layers per chip. High-NA moves from R&D into volume at Intel, Samsung, and eventually TSMC, adding a new pricing tier at ~$380-400M per tool. The order book (€38.8B backlog at end-2025, +48% FY2025 bookings) was the leading indicator, and it flashed green before ASML retired the quarterly disclosure. Validation now: FY2026 revenue at or above the raised €36-40B guide, “order intake” staying strong on the calls, gross margin marching toward the 2030 target.
Bear case (what breaks it): the ~22% implied hurdle is simply too high across a full cycle. China (29% of sales, declining toward ~20%) contracts faster than AI demand fills the hole. The current AI-capex intensity proves to be a pull-forward, and 2027-2028 sees a digestion air-pocket like 2024’s. At 53x EV/FCF, even a modest growth disappointment re-rates the multiple hard, that’s the risk of paying a premium for a cyclical, no matter how good. Invalidation of the bull: a downward revenue-guidance revision (now that ASML no longer prints quarterly bookings, the guide is the tell), softening “order intake” language on the calls, or a China restriction that hits the service revenue base.
One honest caveat on that low case. The €958 DCF-low only haircuts the growth rate to ~15%; it holds working capital neutral. But a real 2027-28 digestion air-pocket wouldn’t just slow growth, it would reverse the customer-advance float the way 2023 did, so a trough-year FCF could print far below what a smooth 15%-growth line implies (recall FCF fell to €3.25B in 2023 even as revenue climbed). In other words, the €958 low probably understates the drawdown in a genuine down-cycle. The true bad-case FCF, and the price the market would pay for it in the moment, is lower than the ladder’s low rung suggests. That asymmetry is the real risk of paying a software multiple for a cyclical.
What would change my view: if FY2026 revenue lands at or above the raised €36-40B guide and High-NA converts to volume orders from more than one customer, the ~22% hurdle stops looking heroic and the premium looks earned, I’d move my intrinsic range up. Conversely, a downward guidance revision or a hard China servicing restriction would pull the floor out from under the multiple, and the €958-987 low anchor would suddenly look like the base case, not the tail, or worse, given how working capital behaves when the tide goes out.
The monopoly you can’t buy cheap
ASML is the rare business where the bull thesis and the bear thesis agree on the facts. Best moat in hardware. Cleanest balance sheet. A 39% ROIC that most CFOs would frame and hang on the wall. Nobody serious disputes the quality.
The entire argument is the price. You are being asked to pay ~53x free cash flow and to underwrite a decade of ~22% growth for a company whose history says 15% and whose largest recent market is shrinking by policy. The monopoly is real. The perfection the price assumes is not yet proven. And the gap between those two sentences is exactly the risk you’re taking at €1,526.
Watch the July 15 Q2 report. Not the earnings-per-share beat, the full-year guidance and the tone on order intake. ASML retired its quarterly bookings disclosure this year, so the guide is now the cleanest read on whether the AI-capex wave is still building or starting to crest, and any revision to that €36-40B range will move this stock more than the quarter itself.
What’s your read? Is ASML’s monopoly worth paying a decade of ~22% growth for, or is the semiconductor cycle about to remind everyone why cyclicals don’t deserve software multiples? I’d genuinely like to hear the other side, tell me on X or LinkedIn.
Keep reading: If you want to see this same “great business, fair price?” framework applied to a company where capex does distort the free-cash-flow line, read my breakdown of Microsoft’s quality-versus-price problem and my look at Meta’s double capex-and-tax distortion. Or browse the full Finance category for more valuation deep-dives.
Related analysis — the AI semiconductor value chain
ASML sits at the very top of the stack. Following the chain downstream:
- TSMC at NT$2,445: The Foundry the World Can’t Replace — ASML’s key customer; buys the EUV machines to build leading-edge chips.
- NVIDIA at $195: Priced for a Decade of 28% Growth — designs the AI accelerators TSMC fabricates on ASML’s tools.
- Microsoft at $390: The Market Is Misreading a Hyperscaler and Meta at $583: Two Accounting Distortions Hiding a 22% Grower — the hyperscalers whose AI capex funds demand flowing back up the chain.
Research note: financial data sourced from Yahoo Finance (via the local finance service), as of July 8, 2026, with figures in euros (ASML.AS trades in EUR, matching its EUR-reported statements; where a USD lens is used, EUR was converted at 1.1418 EURUSD as of July 8, 2026). All valuation inputs (WACC, growth, target multiples) are derived from ASML’s reported financials, not hand-picked. News and guidance figures are cited inline to ASML’s own press releases, Form 20-F, and Investor Day materials; a couple of second-hand items are tagged [VERIFY]. The latest reported quarter remains Q1 2026 (next results due July 15, 2026); the call-based quotes and guidance were verified against ASML’s own PDFs in a prior pass and carried forward unchanged this update. Pivotal figures should be cross-checked against ASML’s primary filings before any decision. This is original educational analysis, produced with AI-assisted research and drafting, and manually verified.