Boeing trades at 92 times trailing earnings. That number is worthless, and if you anchor on it you’ll misread this stock completely.
Here’s why. A price-to-earnings ratio only means something when earnings are normal. Boeing’s aren’t. The company just clawed its way from a $11.8 billion net loss in 2024 to a $2.24 billion profit in 2025, on record revenue of $89.5 billion. When a company earns almost nothing relative to what it eventually should, its P/E goes to the moon by arithmetic, not because the stock is expensive. Divide a huge price by a tiny sliver of earnings and you get a scary multiple that tells you nothing. This is the trough-earnings trap, run in reverse: the same math that makes a cyclical look cheap at the top makes a recoverer look absurd at the bottom.
So the whole exercise with Boeing is different from valuing a steady compounder. You don’t ask “what does it earn today?” The answer is roughly nothing, and the stock isn’t priced on today. You ask: can it execute the production ramp back to normalized free cash flow, and delever before the balance sheet forces its hand? That’s the bet. Everything else is detail. Every figure below is pulled from Boeing’s own statements as of July 8, 2026; I’ve flagged where the standard valuation tools simply break on a company like this.
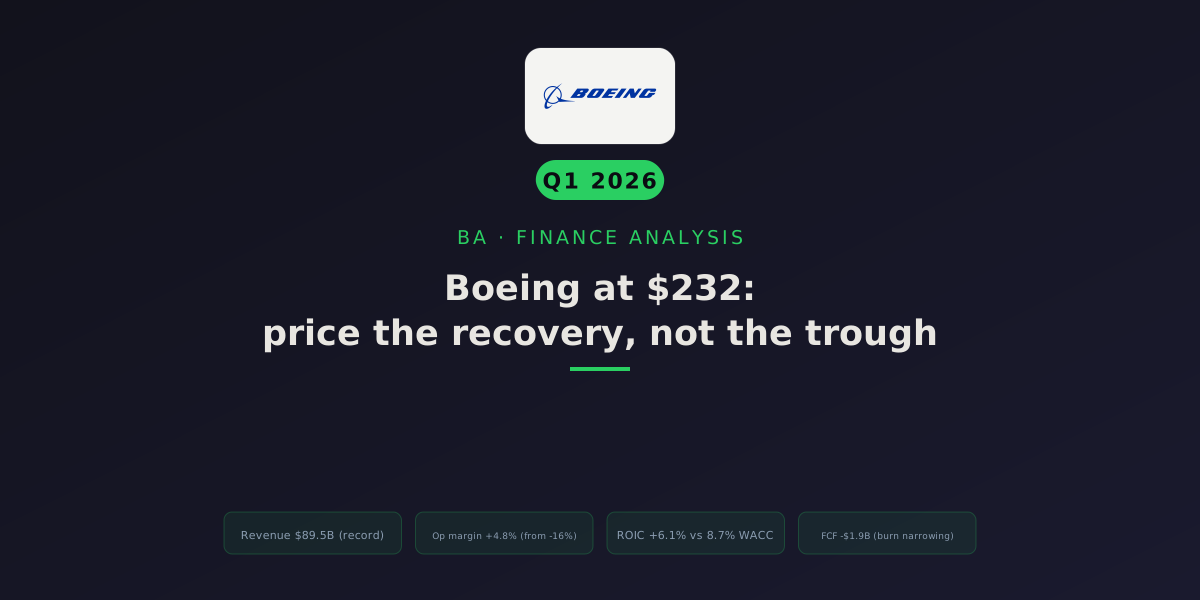
FY25 revenue was an all-time high, above even the pre-crisis peak. The recovery is real: more planes delivered, backlog converting to cash. Revenue was never Boeing’s problem — production and quality were.
Operating margin swung from a catastrophic -16.1% in 2024 (charges, a strike, the quality crisis) to +4.8% in 2025. Positive, but a fraction of the ~10%+ this business earns when it runs normally. The gap between here and normal is the upside — and the uncertainty.
Return on invested capital turned positive for the first time in years, but at 6.1% it still sits below the ~8.7% cost of capital. Boeing is not yet creating value per dollar invested. The thesis is that it will as volume normalizes — the inverse of a moat eroding.
FCF is still negative, but the burn narrowed from -$14.4B in 2024 to -$1.9B in 2025. The single most important number to watch: the date it turns durably positive. Until then, Boeing funds itself with a stressed balance sheet.
The recovery arc is the whole story
Let me start with the picture that matters, because Boeing is not a business you understand from a snapshot. You understand it from the trajectory.
Return on invested capital is where I always start, because it answers the one question that decides whether a business is worth owning: does a dollar put to work come back as more than a dollar? For a healthy company you want to see ROIC comfortably above the cost of capital, year after year. That gap is value creation.
Boeing fails that test today. And that’s the point.
Notice how differently this reads from a compounder. When Microsoft’s ROIC dips, it’s denominator inflation from a capex build — the business is fine, the accounting lags. When Boeing’s ROIC is below the line, it’s because the business genuinely wasn’t working: planes weren’t shipping, charges were piling up, cash was pouring out. The recovery isn’t a data artifact. It’s an operational fact that either continues or doesn’t.
What broke, and what’s mending
The clearest way to see a turnaround is to put profitability and cash on the same timeline. One tells you whether the business is earning; the other tells you whether it’s surviving. In a crisis they diverge violently, and Boeing’s 2024 is a textbook example.
That 2024 trough deserves a moment. Operating income of negative $10.7 billion. A net loss of $11.8 billion. Fourteen and a half billion dollars of cash out the door. Boeing has been in existence since 1916, and 2024 was one of the worst financial years in its history, driven by the fallout from the January 2024 Alaska Airlines door-plug blowout, the resulting FAA scrutiny and production caps, charges on the 737 and 777X programs, and a costly machinists’ strike late in the year.
Then 2025: record revenue, a return to profit, positive operating margin. The planes started moving again.
The cash burn was the emergency. It’s easing.
Revenue was never really Boeing’s problem. The order book has been full for years. The problem was converting orders into delivered aircraft and delivered aircraft into cash. So the revenue-versus-cash chart is the one that shows whether the machine is actually working.
The balance sheet is the constraint, stated plainly
This is the part of the Boeing story that keeps sober investors up at night, and it deserves neutral, factual treatment rather than drama.
I want to be careful with tone here. A stressed balance sheet is a fact about the numbers, not a verdict on the people. Boeing didn’t lever up out of recklessness; it borrowed to survive a genuine external and self-inflicted crisis, which was the rational move at the time. But the consequence is a real constraint on the equity thesis today.
The liability schedule is where that constraint gets concrete, and for a distressed name the maturity wall is part of the thesis. Boeing has meaningful debt coming due across 2026-2028: several billion dollars per year of maturities that either get repaid from cash, refinanced at prevailing rates, or rolled. Refinancing today means issuing into a market that prices Boeing at roughly BBB-/Baa3, one notch above high yield (Moody’s, S&P Global Ratings). That rating is the hinge. A downgrade to junk would raise the cost of the entire debt stack, shrink the pool of investors who can hold the paper, and is itself a solvency trigger, since some covenants and counterparties treat a junk rating as an event. So the recovery isn’t only about earning more; it’s about clearing near-term maturities and defending the investment-grade rating long enough for cash generation to do the deleveraging. If the recovery stalls and the burn resumes, the company either raises equity (diluting shareholders at a low price), sells assets, or stretches suppliers. The balance sheet is why execution isn’t just about upside; it’s about downside protection too.
Capital allocation: there isn’t any, and that’s correct
Here’s a section that would normally have a chart. For Boeing, it’s blank, and the blankness is informative.
Boeing pays no dividend. It suspended the payout in March 2020 and has not restored it. It isn’t buying back stock. Every dollar of internally generated cash, and then some, is going toward one of two things: funding the production ramp (working capital, capex to stabilize the factories) and servicing or reducing debt. This is a company in survival-and-repair mode, and the capital-allocation “strategy” is simply: don’t run out of money, get the planes flying, fix the balance sheet.
That’s the right call. A turnaround that pays a dividend or buys back stock while burning cash and carrying 1.5x interest coverage would be allocating capital backwards. The absence of shareholder returns isn’t a knock here; it’s discipline. The signal to watch is the reverse: the day Boeing announces it’s restoring the dividend or authorizing a buyback will be management telling you they believe the balance sheet is repaired and cash generation is durable. That announcement, whenever it comes, is a milestone worth more than the payout itself.
Why every standard valuation tool breaks here
Now the fun part. If you feed Boeing into a normal valuation model, the model returns garbage. This is worth showing, because it’s exactly why the “92x P/E, sell” and the “cheap on price-to-sales, buy” takes are both lazy.
Look at the reverse-DCF, the tool I usually lead with. It’s supposed to tell you what growth rate the current price implies. For Boeing, the model returns nothing usable, because you can’t compound a growth rate off a negative starting free cash flow. The forward DCF does the same: negative starting FCF, no fair value. The models don’t fail because Boeing is worthless. They fail because a discounted-cash-flow engine needs positive cash flow to discount, and Boeing doesn’t have it yet. That’s the definition of a turnaround: the value is entirely in cash flows that don’t exist today but plausibly will.
So what’s it actually worth? Value the recovery.
If trailing multiples lie and the DCF won’t run, you value Boeing the way you value any turnaround: estimate normalized earnings and free cash flow — what the business generates once it’s running at a healthy, sustainable production rate — and value that stream, then discount for the risk that it doesn’t get there.
Before the anchors, the normalization has to be earned segment by segment, because Boeing isn’t one business. Commercial Airplanes is where the margin recovery lives: return the 737 and 787 to normal build rates and the crisis-era charges fall away, carrying this segment from loss back toward its historical high-single-digit margin. Global Services is already healthy — high-margin aftermarket parts and maintenance that never really broke. The overhang sits in Defense, Space & Security (BDS): a cluster of fixed-price development contracts (KC-46 tanker, VC-25B Air Force One, T-7, MQ-25, Starliner) where Boeing eats cost overruns, and where it has taken repeated multibillion-dollar charges. Normalized BDS margin is a genuine question mark — the bull assumes the charge cycle is ending and the segment returns to low-to-mid single digits; the bear assumes fresh charges keep landing. My normalized ~$10B FCF anchor assumes Commercial recovers, Services holds, and BDS stops bleeding but doesn’t become a star. If BDS keeps taking charges, the base case slips.
The anchors I’d use, all netting the $29.4B net-debt figure reconciled above, all triangulating the same place:
| Method | Normalized assumption | Implied value per share |
|---|---|---|
| Normalized FCF | ~$10B FCF (Street/mgmt ~2027–28) × 18x EV/FCF, less $29.4B net debt | ~$190 |
| Normalized FCF (haircut) | ~$10B FCF × ~14x (distressed-name multiple), less net debt | ~$140 |
| Normalized FCF (bull) | ~$13B FCF × 18x, less net debt | ~$260 |
| EV / sales | ~$100–112B sales × ~2.0x EV/S | ~$215–250 |
| Normalized EPS | ~$10 EPS × ~20x | ~$200 |
| Analyst mean (25 analysts) | Consensus target | $270.44 |
That’s a blended intrinsic range of roughly $190 to $260, with the analyst consensus sitting a touch above at $270. Note the haircut row: if you refuse to pay a clean-compounder 18x for a company that still burns cash and carries 1.5x coverage, and instead apply a distressed 14-15x, the base case drops toward $140 — below today’s price. The multiple you’re willing to pay on normalized cash is itself a big swing factor, and the market is clearly paying up for the recovery landing. The current price of $231.68 lands in the upper-middle of the honest range.
Intrinsic value · the verdict
Blended fair value
$230
Current price
$232
Margin of safety
-1%
Fair values from multiple methods (see above). Source: Yahoo Finance + author normalized-earnings estimates · as of July 2026. Illustrative, assumption-driven, not a price target.
One number I owe you before the read: the finance-service model spits out a mechanical fair value of $180 per share, a -22% margin of safety versus the current price. I’m deliberately overriding it upward to a ~$230 midpoint, and you should know why rather than take my number on faith. That $180 is an average of multiple-based methods that are broken on a company like this: it applies today’s distorted trailing and forward multiples (a 55x forward P/E, a negative EV/FCF, a negative EV/EBITDA) to trough metrics, then averages the wreckage. It’s the same trap I spent the whole valuation section warning against, just automated. My normalized anchors deliberately look through the trough to what the business earns at healthy production rates. But the model’s $180 is a useful gut-check in one direction: it says if you don’t believe the normalization, there’s real downside, and the honest low end of my range (the $140 haircut case) isn’t far from it.
There’s a harder downside anchor still, and it’s the one that makes this an option, not a bond. If the recovery stalls and free cash flow stays negative through 2027, Boeing very plausibly raises equity to shore up the balance sheet. A $10 billion raise at, say, ~$180 per share would issue roughly 55 million new shares on ~788 million outstanding, about 7% dilution, and it would likely come at a depressed price precisely because the recovery had disappointed. That’s the mechanism by which the equity behaves like a call option on the turnaround: enormous upside if production and cash normalize, but a real path where existing holders get diluted at the bottom. You’re not buying a claim on stable cash flows; you’re buying a levered bet on the ramp, with the balance sheet as the strike price.
So here’s the honest read. At $232, the market is not pricing Boeing as a broken company, and it’s not pricing it as a fully healed one either. It’s pricing in a successful-but-not-yet-complete recovery. You are paying roughly fair value for the base case that Boeing gets back to ~$10 billion of free cash flow and normal margins over the next couple of years. There’s no obvious margin of safety versus my intrinsic estimate — the price sits right on it, and versus the model’s $180 you’re paying a premium. Versus the $270 analyst mean there’s a modest ~15% cushion, but consensus is itself betting on the recovery landing.
Which means the whole thing reduces to one sentence. The bet on Boeing is not about valuation multiples; it’s about execution: can the company ramp 737 and 787 production to normalized rates, turn free cash flow durably positive, and delever — before the stressed balance sheet forces a bad decision? Get that right and the bull anchors (backlog, duopoly, margin recovery) pull it toward $260-plus. Get it wrong and the balance sheet, not the income statement, writes the ending.
The duopoly is the reason to bother at all
Why give a loss-strewn, debt-laden company the benefit of the doubt? Because of what it is. Boeing and Airbus are the entire global market for large commercial jets. That’s it. Two companies. If an airline needs a few hundred narrowbodies, it has exactly two phone numbers to call, and Airbus’s order book is booked out for years. That structure is an extraordinary moat — it’s just been buried under Boeing’s self-inflicted operational wounds.
The evidence is in the backlog. Boeing sits on a commercial backlog north of $500 billion — years of contracted demand, orders customers have already committed to. The demand isn’t the question. Airlines want the planes. The question is purely whether Boeing can build them, safely and on schedule, and get paid. Layer on the Defense, Space & Security segment and Global Services (high-margin aftermarket parts and maintenance on a huge installed base), and you have real ballast under the volatile commercial business.
A moat that produces a duopoly with a half-trillion-dollar backlog is why a recovery is even plausible. The customers are captive. The product is essential. The only broken part is the factory, and factories can be fixed.
Tailwinds and headwinds, weighed honestly
Every dollar of the bull case runs through execution. Every dollar of the bear case runs through the balance sheet and Boeing’s track record of missing its own timelines. Let me lay both out.
Tailwinds (the bull case):
- Contracted demand. A ~$500B+ commercial backlog means revenue is largely pre-sold. Boeing doesn’t need to win the market; it already has, structurally. It needs to deliver.
- Margin recovery runway. At +4.8% operating margin against a historical ~10%-plus, there’s a lot of room to climb simply by returning to normal production efficiency and shedding crisis-era charges.
- Duopoly pricing power. With Airbus capacity-constrained and only two suppliers on earth, Boeing has structural pricing and demand support that few industrials enjoy.
- The cash inflection. FCF burn narrowed from $14.4B to $1.9B in a year. If the 737 MAX ramp toward the low-40s per month and the 787 ramp hold, the Street models free cash flow turning firmly positive and heading toward ~$10 billion by 2027–28. That’s the number that repairs the balance sheet.
Headwinds (the bear case):
- The balance sheet and the maturity wall. ~$29.4B net debt (reconciled above), 1.5x interest coverage, and several billion dollars of maturities coming due each year across 2026-2028 that must be repaid or refinanced. The credit rating sits at roughly BBB-/Baa3, one notch above junk; a downgrade raises the cost of the whole stack and is itself a solvency trigger. A stalled recovery could force a dilutive equity raise (a ~$10B raise near $180 would be ~7% dilution at a bad price) or asset sales. On a stricter owner-earnings basis, 2025’s burn was closer to -$4.8B than the reported -$1.9B.
- Execution and Boeing’s own record. This is material and I’ll state it factually: Boeing has repeatedly missed its own production-rate and cash-flow timelines over the past several years. Every prior “we’ll be at rate X by date Y” has tended to slip. That history is a reason to apply a real haircut to current guidance, not to take the recovery trajectory as a straight line.
- Regulatory and quality risk. The FAA capped 737 MAX production after the 2024 door-plug incident. Production rate increases require regulatory sign-off tied to demonstrated quality and safety. Another quality escape resets the clock and the trust.
- Cash flow is still negative. For all the improvement, Boeing consumed cash in 2025. The recovery is directional, not complete, and the thesis requires it to finish.
On the timeline-credibility point especially: because live transcript access was unavailable at the time of writing, I’m relying on the reported financials and Boeing’s public track record rather than fresh call quotes. Boeing next reports on July 28, 2026 — the production rates (737 toward the low-40s per month, 787 ramp), the cash-flow-turn timing, any fresh defense-program charges, and FAA commentary are the exact items to check against what management has promised before. Treat the guide with skepticism earned by history.
The one thing to watch
Forget the P/E. Forget, even, the quarterly revenue beats. There is exactly one number that decides whether Boeing at $232 works out: the quarter free cash flow turns durably, structurally positive. That’s the moment the recovery stops being a hope discounted into the price and starts being a fact that repairs the balance sheet, restores the option of returning capital, and lets ROIC climb decisively over that 8.7% line.
Until that quarter arrives, everything is trajectory and trust. The duopoly guarantees the demand. The backlog guarantees the orders. Neither guarantees the cash. And a company with 1.5x interest coverage doesn’t get unlimited time to prove it can generate the stuff.
What’s your read — is Boeing’s recovery far enough along to be worth the balance-sheet risk, or is the market pricing the turnaround as complete before the cash flow confirms it? I’d genuinely like to hear the bear case. Come argue with me on X or LinkedIn.
Keep reading: if you want the mirror image of this analysis — a company whose free cash flow looks weak but for the opposite reason (a deliberate capex build, not a crisis) — see my breakdown of why the market may be misreading Microsoft as a hyperscaler. For a deep-cyclical where the trick is normalizing through the cycle rather than through a recovery, there’s ASML and the EUV monopoly. Or browse the full Finance category for more valuation breakdowns.
Research note: financial data is from Yahoo Finance (via the finance-service snapshot), as of July 8, 2026, cross-checked against Boeing’s reported FY2025 figures. The valuation nets $29.4B of net debt (the reconciled figure: ~$49.6B narrower debt against ~$20.2B of cash and short-term investments), which differs from the ~$54.4B/$10.9B consolidated debt-and-cash shown in the balance-sheet chart; Boeing Capital customer-financing debt is arguably self-liquidating and not fully attributable to the equity. The finance-service model’s mechanical fair value is $180 (a -22% margin of safety); I override it to a ~$230 midpoint because that model averages trailing/forward multiples that are distorted on a trough-earnings recoverer — my normalized-FCF, EV/sales, and normalized-EPS anchors are the author’s estimates, illustrative, not price targets. Credit-rating (~BBB-/Baa3) and maturity-schedule details are directional and should be confirmed against Boeing’s filings and the rating agencies. Standard DCF and reverse-DCF outputs are omitted because negative starting free cash flow makes them non-computable — itself a signature of the turnaround archetype. Live earnings-call transcript access was unavailable at the time of writing, so no verbatim management quotes are included and forward context is qualitative; verify production-rate, cash-flow, maturity, and rating figures against Boeing’s July 28, 2026 report and its primary filings (10-K/10-Q, SEC EDGAR) before relying on any figure.