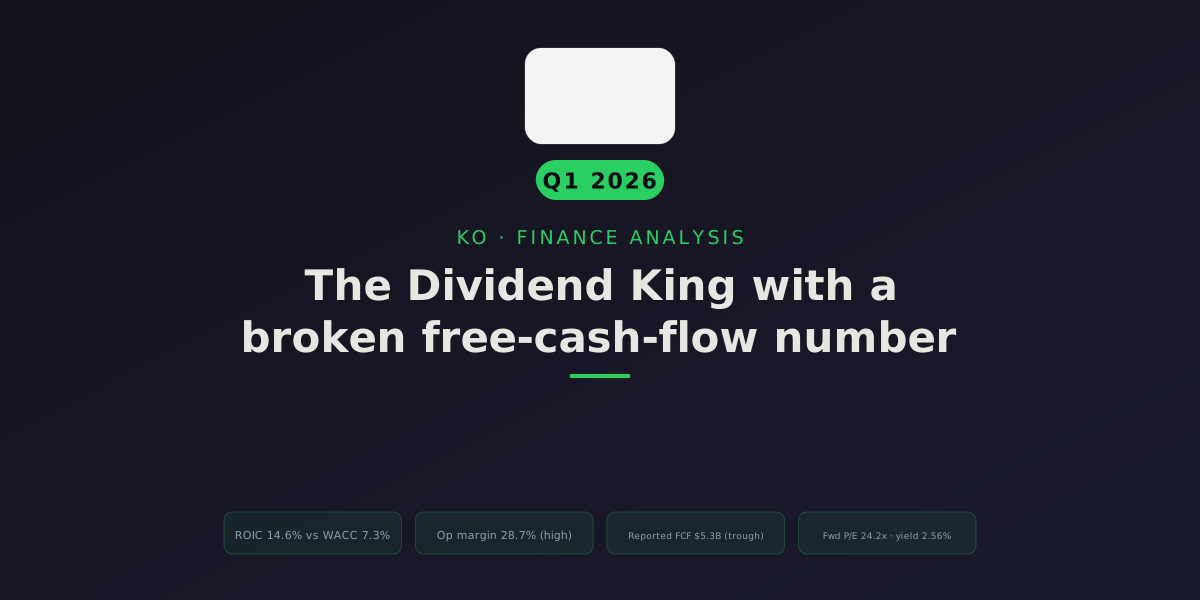
Coca-Cola’s net income rose to $13.1 billion in FY2025. Its free cash flow fell to $5.3 billion. Both numbers are true, and if you only look at one of them you will reach exactly the wrong conclusion about the stock.
That gap is the whole story here. On a screener, KO now shows an EV/FCF of 74x. Seventy-four times free cash flow for a company that grows revenue in the low single digits looks indefensible at first glance. And it would be, if that $5.3 billion were the real cash the business throws off. It isn’t. The denominator is broken, and understanding why it’s broken is the difference between seeing a Dividend King priced sensibly and a mega-cap trading at a software multiple.
So here’s the answer up front, in the 40-second version. Coca-Cola is a capital-light, wide-moat consumer-staples compounder trading around $84.05 (as of July 8, 2026), roughly in line with the $86 analyst mean. Its headline free cash flow looks disastrous only because of one-time cash outflows (a large IRS tax deposit and fairlife earnout payments) that have nothing to do with the health of the business, where margins and net income actually rose. Normalize the cash flow and the valuation looks like what it is: a premium, but a defensible one, for one of the most durable franchises on the market.
That’s the thesis. Now the math.
Return on invested capital measures cents of after-tax profit per dollar put into the business. At 14.6% against a ~7.3% cost of capital, KO earns roughly double its hurdle rate. For a 140-year-old brand company with net cash needs already met by bottlers, that is the fingerprint of real pricing power.
Nearly 29 cents of operating profit per dollar of sales, up from 25.4% in 2022. Rising margins on a mature staple mean pricing is outrunning input costs, not that costs are being cut to the bone. That is the healthy kind of margin expansion.
Free cash flow = operating cash flow minus capex. The $5.3B is artificially low: FY2025 converted only 57% of a record $13.1B net income into $7.4B of operating cash, versus its normal ~100%+. That ~$5.7B net-income-minus-OCF gap is one-time cash (chiefly the ~$6B IRS deposit, plus fairlife earnout activity). Anchoring to the clean FY22–FY23 average OCF of $11.3B less capex, normalized run-rate FCF is roughly $9.2–9.4B.
You pay about 24 times next year's expected earnings. Rich versus the market average for low-single-digit growth, but consistent with how quality staples have traded for years. The debate is whether mid-single-digit organic growth plus buybacks plus a 2.56% dividend (payout ~65%) justifies it.
A note before the charts: every figure here is computed from Coca-Cola’s reported financials (via the local data service, sourced to Yahoo Finance as of July 8, 2026, cross-checked against the company’s structure), not hand-picked to make a case. The discount rate and growth assumptions are derived from the data. Where I override the model with judgment, I say so.
What kind of business is this? Classify before you value
Get this step wrong and every number downstream is wrong. Coca-Cola is a capital-light, wide-moat consumer-staples compounder, and it is the near-perfect opposite of the AI-capex hyperscalers I’ve written about lately.
Where Microsoft and Meta are pouring tens of billions into data centers and suppressing their own free cash flow in the process, Coca-Cola spends about $1.5–2.1 billion a year on capex against ~$48 billion in revenue. That’s roughly 4% of sales. It doesn’t own most of the bottling and distribution that carries its product around the world; that capital sits on the balance sheets of independent bottlers. Coca-Cola sells the concentrate, owns the brand, sets the strategy, and lets partners run the trucks and plants. Asset-light by design.
The moat has two legs. First, brand: Coca-Cola is one of the most recognized trademarks on the planet, and that recognition translates into shelf space and pricing power that a private-label cola simply cannot dislodge. Second, distribution: the bottler network reaches more points of sale, in more countries, than any competitor could rebuild. That’s a scale-and-intangibles moat with a real switching-cost overlay at the retailer level, and it shows up where moats always show up, in returns on capital that sit far above the cost of capital, year after year.
So the value question here is not a capex-return bet, the way it is for a hyperscaler. It’s simpler and older: is the roughly 24x forward multiple justified by mid-single-digit organic growth, share buybacks, and a growing dividend? To answer that, I first have to deal with the number everyone gets wrong.
The broken number: why EV/FCF says 74x
Look at the two lines that should move together and usually do. In FY2022 and FY2023, Coca-Cola converted essentially all of its net income into operating cash flow: OCF of $11.0B and $11.6B against net income of $9.5B and $10.7B. Clean, right around 100%+ conversion. Then in FY2024 operating cash flow collapsed to $6.8B even as net income held at $10.6B, and in FY2025 OCF was $7.4B against a record $13.1B of net income. That’s a 57% cash-conversion ratio versus the ~100%+ this business normally runs.
When earnings rise and operating cash flow falls by billions, something non-operational is draining cash. Here it is not capex (capex is tiny and stable, $2.06B in FY24 and $2.11B in FY25). It’s one-time cash items flowing through the operating line. The measure to focus on is the divergence between net income and OCF: $13.1B minus $7.4B is a ~$5.7B shortfall.
Here is the honest limit of what I can source this session, because the whole “one-time ~$6B” thesis rests on it. I want to show you the FY2025 cash bridge line-by-line, deposit, earnout, residual working-capital swing, from Coca-Cola’s FY2025 10-K. I could not open the 10-K this session (my document-fetch tooling was down), and the local dataset does not break out the individual cash-flow lines. So the size and composition of the shortfall below are [VERIFY] against the 10-K’s Consolidated Statements of Cash Flows and the income-tax and business-combination footnotes before you rely on the split:
- ~$5.7B = the FY2025 net-income-minus-OCF gap (from the statements I do have: $13.1B NI − $7.4B OCF). This total is solid; it’s the arithmetic of two reported numbers.
- ~$6B IRS transfer-pricing deposit [VERIFY] = the largest documented driver, a cash deposit against the disputed tax that runs through the operating section. Coca-Cola has publicly discussed a deposit of roughly this size tied to the dispute; confirm the exact amount and the year it hit the cash-flow statement in the 10-K.
- fairlife contingent-consideration (earnout) payments [VERIFY] = a second cash outflow tied to the 2020 fairlife acquisition, part of which flows through operating activities under accounting rules. Amount not broken out here; check the business-combination footnote.
- residual working-capital swing [VERIFY] = whatever remains after the two items above; the dataset shows a FY2025 working-capital movement I treat as roughly -$1.0B, which I flag as non-recurring earnout mechanics rather than a structural change.
The load-bearing point is narrower than the exact split, and it survives even if the split is unverified: reported OCF fell by billions in a year net income hit a record, and capex barely moved, so the drain is non-operational cash, not a weakening franchise. The transfer-pricing dispute is a genuine overhang worth watching, but a deposit is a timing event, not a permanent leak.
Now normalize, and keep the two measures distinct. The $5.7B above is the net-income-minus-OCF gap: the size of the one-time cash that left in FY2025. A separate calculation gives normalized run-rate cash generation. Rather than invent a figure, anchor it to the clean years: FY22 OCF was $11.02B and FY23 was $11.60B, a two-year average of $11.3B. So a business now two years larger reasonably runs ~$11.3B of normal OCF. Subtract ~$2.1B of capex and normalized free cash flow is about $9.2 billion; I round toward ~$9.4B in a few places below, and I’ll flag it, that round-up is a generous $0.2B, so read the normalized figure as a $9.2–9.4B band, not a precise point. Run the midpoint through the same enterprise value ($393B) and EV/FCF drops from 74x to roughly 42x. Still a premium. But 42x for a fortress-brand compounder is a different conversation than 74x for a business that looks like it’s hemorrhaging cash. It isn’t hemorrhaging anything.
One objection I have to pre-empt, because a hostile reader will raise it: this is two weak years, not one. FY2024 converted $10.6B of net income into just $6.8B of OCF (~64%), and FY2025 converted $13.1B into $7.4B (~57%). Two consecutive sub-normal years is exactly the pattern that separates a genuine one-time item from the start of a structural decline, so “it’s a blip” is not something to assert and move on. Here’s why I still read it as timing, not deterioration. The IRS transfer-pricing dispute has a multi-year cash cadence: a deposit of this size doesn’t necessarily land in a single clean quarter, and the fairlife earnout was itself an installment mechanic that straddled reporting periods. Two years of drag from two multi-year cash events is what you’d expect, not a surprise. What would disprove the timing read is simple and I’m naming it as the watch metric: cash conversion must mechanically re-converge toward ~100% in FY2026 as those items roll off. If FY2026 prints a third straight year of ~60% conversion with no fresh one-time explanation, the “trough” framing is wrong and the business is quietly generating less cash than its income statement claims. That single line, FY2026 OCF versus net income, is the falsification test for this entire thesis.
This is the same category error as the trough-multiple trap I keep flagging in capex-heavy names, just inverted. There, a static multiple on a build-year understates a hyperscaler. Here, a live FCF multiple on a one-time-cash-outflow year overstates how expensive Coca-Cola is. The discipline is identical: find the number the business actually earns through the cycle, and value that.
Returns on capital: the moat you can measure
A moat that doesn’t show up in returns on capital is a story, not a moat. Coca-Cola’s shows up. FY2025 NOPAT of $11.3B on $77.7B of invested capital is a 14.6% return, well above the ~7.3% weighted cost of capital the model derives from KO’s low beta (0.35) and modest leverage. The dip to 11.7% in FY2024 lines up with the same compressed cash-and-margin year, not with any erosion of the franchise; margins snapped back in 2025 and so did the return.
Consumer staples don’t produce the eye-watering returns of a fabless chip designer. What they produce is consistency: a 14% return that shows up every year, through recessions and currency swings, without a capex bet that has to pay off. That reliability is precisely what the market pays a premium for.
Margins: the trend says pricing power
Level matters less than direction. A company holding a flat margin by squeezing costs is running low on room. A company expanding margin while growing revenue is charging more for something people can’t easily substitute. Coca-Cola is the second kind: gross margin has stepped up every year, and operating margin, after a soft 2024, printed 28.7% in 2025. Some of that reflects genuine pricing on the brand and a richer mix; some reflects the concentrate model, where the company keeps the high-margin syrup economics and pushes the low-margin logistics onto bottlers.
The one caveat the screen surfaces: operating margin declined in two of the last five years. Against a gross margin that never stopped rising, I read that as charge-driven noise rather than a structural crack. But it’s the sort of thing I’d want the next earnings report to confirm rather than assume.
Put the margin next to reported free cash flow and the divergence at the heart of this whole piece jumps off the page: profitability climbed to a high in the same year cash flow fell to a trough.
The balance sheet: moderate leverage, not a fortress
Coca-Cola carries roughly $44.6B of total debt against $13.8B of cash, for net debt near $30.8B. At 1.84x EBITDA, that’s comfortably inside investment-grade territory, and 8.3x interest coverage means the company earns more than eight times its interest bill. This is not a company at risk. But I won’t call it a fortress the way I would a net-cash chipmaker: KO runs a levered balance sheet on purpose, because a stable, defensive cash-generative franchise can safely carry debt to support a payout that has grown for six decades. The trade-off is that a chunk of the capital structure is spoken for, and in a genuinely higher-for-longer rate world, refinancing that stack gets marginally more expensive over time.
Capital allocation: dividend first, and it shows
Coca-Cola is one of the small handful of companies that have raised their dividend every year for more than six decades. The capital-allocation breakdown makes the priority obvious: dividends come first, and everything else, buybacks, bolt-on acquisitions like fairlife, capex, is fit around that commitment.
The dividend itself is the whole point of owning this stock for most of KO’s shareholder base, so it deserves its own look. Two things matter: the growth streak and where today’s yield sits versus its own history.
On the streak: Coca-Cola is a bona fide Dividend King, having raised its payout for more than six decades. It declared its 63rd consecutive annual increase in February 2025 (Coca-Cola investor press releases), which puts the record at over 60 straight years, one of the longest in the market. (I could not open the exact release permalink this session to re-confirm the 63rd figure verbatim; verify it against the dated February 2025 dividend-declaration release before relying on the precise count.) The five-year dividend CAGR of about 4.5% comfortably outpaces the ~2% growth in unit-case volume, which tells you the dividend growth is funded by pricing, mix, and buybacks shrinking the share count, not by volume alone.
Worth naming: the model shows the payout at 112% of reported free cash flow. On the trough denominator that looks unsustainable. On normalized ~$9.4B FCF, it’s covered with room to spare, and the 60-plus-year record of consecutive increases is the clearest evidence of how the board prioritizes the payout. The red-flag screen, for what it’s worth, raised no flags at all beyond the two-year operating-margin wobble already discussed. Also note the governance change this cycle: Henrique Braun stepped into the CEO and Director role, James Quincey moved to Executive Chairman, and John Murphy remains President and CFO. A leadership transition at a franchise this stable reads more as continuity than as a strategic pivot, but it’s the kind of thing worth tracking through the first couple of reporting cycles under the new chief.
The price: what does $84 actually assume?
Start with the reverse-DCF, because it reframes the whole debate. Instead of asking “what is Coca-Cola worth?” (unknowable), it asks “what growth does today’s price require?” (judgeable). The model says $84.05 implies about 16.1% annual FCF growth for a decade. For a business that grows revenue ~2–4% a year, that’s a preposterous bar. If that were the real hurdle, KO would be wildly overvalued.
But it’s the trough-FCF trap again. That 16% is computed on the depressed $5.3B starting point. Rebuild the reverse-DCF on normalized free cash flow of ~$9.4B, holding the same $84.05 price, 7.3% WACC, and 3% terminal growth, and the required growth rate drops to about 9% a year. That’s roughly a seven-point collapse in the hurdle from simply fixing the denominator. Nine percent is still above KO’s ~2–4% organic revenue trend, so I won’t pretend the price is undemanding, but it’s the kind of number a Dividend King can approach through pricing, mix, buybacks shrinking the share count, and the mechanical re-convergence of reported FCF as the one-time cash items roll off. Sensitivity check, because reverse-DCF hurdles move with the discount rate: nudge WACC to 8% and the implied hurdle on normalized FCF rises to ~11%. The point survives either way, the scary 16% was an artifact of the broken starting cash flow, not a real demand of the price.
Against 24 covering analysts, the mean price target is about $86 (range $71.38–$92, “buy”), placing today’s $84.05 essentially at fair value on the Street’s read. Peers trade in a similar zip code: quality beverage and staple compounders generally command low-to-mid-20s forward P/E multiples, so KO isn’t an outlier within its own category. The premium is a category premium, and the question is whether you think it’s earned.
What is it actually worth?
Here’s where I have to be honest about the model’s limits, because the framework hands me a number I’m going to reject outright.
The derived forward-DCF spits out a fair value of about $28 per share. Ignore it. That figure capitalizes the trough. It starts from $5.3B of depressed free cash flow and grows it at ~2.4%, which mechanically produces a fair value a third of the current price. It is the exact same category error as valuing a homebuilder on its land-buying year, just pointed the other way. A DCF is only as good as its starting cash flow, and this one starts from a number the business doesn’t really earn. So I set the $28 aside as an artifact, not an opinion.
Rebuild it properly, but respect what the DCF can and can’t do here. A slow-growing perpetuity is brutally sensitive to the discount rate: on normalized ~$9.4B FCF growing ~3%, a naive DCF lands near $45/share at 7.3% WACC and closer to $38 at 8%, which tells you the low-growth DCF is too fragile to anchor a fair value for a staple whose worth lives in decades of terminal cash flows, not the explicit window. So I lean on what’s more stable for a business like this: the earnings-based multiples. A mid-20s P/E on ~$3.48 of forward EPS lands right around today’s price, and the model’s multiple-based fair value on non-broken inputs is ~$79. Blend those, and the honest intrinsic range is roughly $78–$92, with a center of gravity right around the low-to-mid $80s. That’s the messy middle: below it, you’re over-weighting the WACC-sensitive DCF; above it, you’re paying up for a staple growing in the low single digits.
Intrinsic value · the verdict
Blended fair value
$86
Current price
$84
Margin of safety
2%
Reverse-DCF check: at $84 the market is implicitly pricing in roughly 16% annual free-cash-flow growth for the next decade. The question isn't whether the business is great. It's whether it can clear that bar.
Fair values from multiple methods (see above). Source: Yahoo Finance; author normalization of one-time cash items · as of July 8, 2026. Illustrative, assumption-driven, not a price target.
One clarification on that card, because the labels matter. The $85.97 headline “fair value” is the analyst mean across 24 covering analysts, not my own model output. My model-derived number is the multiple-based ~$79 on normalized inputs; the blended intrinsic range I’d actually defend is $78–$92. I’m showing the Street’s mean alongside mine, not adopting it as my target. (One housekeeping note on the normalization: I treat the FY2025 working-capital swing of -$1.02B as one-time, tied to the fairlife earnout mechanics, so it’s flagged as non-recurring rather than quietly folded into the “normal” run-rate.)
Two margins of safety, because one number is never enough. Against my normalized intrinsic range ($78–$92, center low-to-mid $80s), today’s $84.05 offers essentially no margin of safety, you’re paying roughly fair value for quality. Against the $86 analyst consensus, the “discount” is about 2%, again basically fair. Neither reading screams cheap. Neither screams expensive. You are being asked to pay a full, fair price for a franchise that rarely goes on sale.
And that reduces the entire thesis to one bet. For a hyperscaler, the bet is whether incremental ROIC on capex clears WACC. For Coca-Cola, it’s different and simpler: can the brand keep pushing price and mix enough to grow organic revenue mid-single-digits, so that dividends plus buybacks plus that growth compound into a market-beating total return from a full starting multiple? The leading indicator to watch is specific: organic revenue holding ≥4–5% while unit-case volume stays non-negative. Price/mix can carry the top line for a while, but if it’s doing all the work because volumes are shrinking, the compounding math quietly weakens. Everything else, the FCF optics, the IRS deposit, the CEO change, is noise around that one question.
Tailwinds and headwinds
The forward case, tied back to that one growth question.
Tailwinds:
- Pricing power intact. Rising gross margins (58% → 61.6%) say the brand is still passing through price without losing the shelf. In an inflationary or even disinflationary world, that’s the durable engine.
- Normalization of cash flow. The IRS deposit and fairlife earnouts are one-time. As they roll off, reported free cash flow should re-converge toward the ~$9B-plus the business actually earns, and the scary screener optics fade on their own.
- Defensive ballast. A 0.35 beta and a 2.56% forward dividend yield (payout ~65% of earnings) make KO the kind of holding that outperforms relatively when markets get rough, even if it lags in a melt-up. The yield sitting just under its 2.89% five-year average is a reminder the stock isn’t on sale.
Headwinds:
- The IRS transfer-pricing overhang. The ~$6B deposit is a one-time cash and timing event, but it’s a floor, not a settlement: the underlying dispute is unresolved, and the potential liability tied to it (interest and penalties on top of the disputed tax) is reported to be larger than the deposit. I could not verify the exact reported range this session, so the figure disclosed in KO’s 10-K should be checked before you size the tail. This is the single biggest company-specific risk, and it’s the reason the next cash-flow statement matters more than the next share price.
- The GLP-1 and health-volume shift. A structural nuance, not a doom story. A meaningful chunk of KO’s volume is still full-sugar sparkling, the category most exposed to weight-loss drugs and the broad move away from sugary drinks in developed markets. But that’s only part of the portfolio: water, tea, coffee, sports drinks, and the fast-growing Zero Sugar line actually benefit from the same health shift, and fairlife (protein-forward dairy) sits squarely in the GLP-1-friendly aisle. Here’s why the concentrate model absorbs the hit better than a bottler could: KO earns on price and mix, not cases hauled, so even if developed-market cola volume goes flat-to-down, richer mix (premium, smaller packs, higher-margin non-sugar lines) plus emerging-market volume can still carry mid-single-digit organic revenue. That’s exactly why the bet above is framed as organic revenue and volume, not volume alone.
- Full valuation, thin margin of safety. At ~24x forward earnings with no discount to intrinsic value or consensus, the price already reflects the quality. There’s little room for a growth disappointment.
- FX and guidance visibility. A strong dollar dents reported international results, which nibbles at the reported growth rate the whole thesis depends on. I could not retrieve KO’s latest earnings-call guidance this session, so treat any specific organic-growth or EPS-guidance figure as needing verification against the company’s own release before you rely on it.
Great business, fair price?
Coca-Cola is unambiguously a great business: a wide moat you can measure in a 14.6% ROIC, expanding margins, and a dividend record that spans generations. The screener’s scariest number, that 74x EV/FCF, is a broken denominator, and once you normalize the one-time cash items it resolves to a defensible ~42x for a franchise this durable.
But great and cheap are not the same thing. At $84 you’re paying essentially fair value, roughly in line with the $86 Street mean, for a company whose growth is measured in single digits. The whole return, then, rests on that one bet: whether the brand can keep nudging organic revenue mid-single-digits so the dividend and buybacks compound from here. If it can, this is a fine long-term hold at a fair price. If organic growth stalls, or the IRS dispute lands badly, there’s no margin of safety to cushion the disappointment. What would change my mind fastest isn’t the share price. It’s the next cash-flow statement, and whether the transfer-pricing overhang finally gets a number attached to it.
What’s your read, does a Dividend King deserve a 24x multiple in a world of 4%-plus risk-free rates, or is the quality premium finally too rich? Come argue it with me on X or LinkedIn.
Keep reading: for the opposite archetype, see how a heavy-capex compounder like Microsoft trades quality against price, or browse the full Finance category for more valuation breakdowns.
Research note: financial data computed from Coca-Cola’s reported statements via a local data service sourced to Yahoo Finance, as of July 8, 2026, and cross-checked against the company’s disclosed structure. Valuation inputs (discount rate, growth) are derived from the data, not hand-picked; where I normalized for one-time cash items I stated the adjustment and its basis. My research tools could not retrieve KO’s latest earnings-call transcript or forward guidance this session, so no verbatim management quotes are included and any specific guidance figure (organic revenue, comparable EPS, free cash flow) should be verified against the company’s own release; the next report is due July 28, 2026. Cross-check pivotal numbers against KO’s 10-K/10-Q on SEC EDGAR before relying on them.