If you run AGNC Investment Corp (AGNC) through a standard stock screener, it looks broken. Enterprise-value-to-free-cash-flow reads about 126x. Return on invested capital comes back empty. Operating margin: blank. Revenue swung from negative $1.1 billion in 2022 to positive $1.8 billion in 2025. Any model built for an industrial or a software company will spit out garbage here, and a reverse-DCF, my usual favorite tool, is a category error.
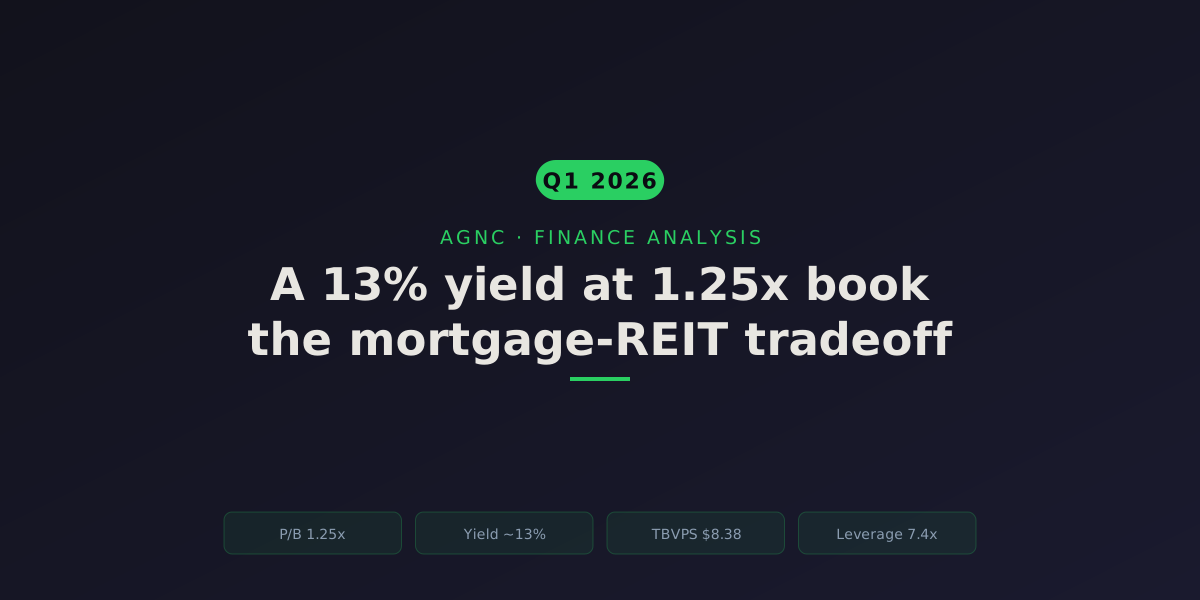
So let me be direct about the one number that actually matters. AGNC trades at roughly 1.25x book value (price $11.12, as of July 8, 2026), pays a monthly dividend that works out to a ~13% yield, and its book value fell 5.6% in a single quarter. That is the whole company in one sentence: a leveraged bet on a bond portfolio, wrapped in a REIT, sold at a premium to the assets it holds.
The question is not “what is AGNC worth as a multiple of earnings.” It’s whether the net interest spread keeps covering the dividend while management protects a book value that can drop double digits when rates and mortgage spreads move against it. That’s the bet. Everything else is noise.
For a mortgage REIT, price-to-book is THE valuation metric: the balance sheet is the business. At 1.25x, the market pays a 25% premium to the net asset value AGNC actually owns. mREITs have historically traded roughly 0.8x–1.1x book, so this is a rich price, not a cheap one.
AGNC pays a monthly common dividend of $0.12, or $1.44 a year, ~13% on an $11.12 price. That headline yield is the entire retail thesis. The real question is whether net spread and dollar-roll income keeps covering it. In Q1 2026 it did, at $0.42 vs the $0.36 quarterly payout.
Tangible net book value per share is the per-share net asset value of the mortgage portfolio. It fell from $8.88 to $8.38 in Q1 2026 as MBS spreads widened. This is the volatility that defines the stock: book value can move several percent in a single quarter.
AGNC funds a ~$95B mortgage portfolio on ~$10B of equity, roughly 7–9x tangible-equity leverage via repo (short-term borrowing against the bonds). This is not distress; it is the deliberate business model. Leverage magnifies both the spread income and the book-value swings.
Why the normal stock-analysis template breaks on a mortgage REIT
Most of what I write here starts with returns on invested capital versus the cost of capital, free cash flow conversion, and a discounted-cash-flow estimate of intrinsic value. For AGNC, throw all of it out. Here’s why, because understanding why the usual tools fail is half the analysis.
AGNC is an agency mortgage REIT (an mREIT). It doesn’t build anything or sell a product. It borrows short-term money in the repo market, uses that borrowed cash to buy a giant portfolio of residential mortgage-backed securities guaranteed by Fannie Mae, Freddie Mac, or Ginnie Mae, and pockets the difference between what the bonds yield and what the borrowing costs. That difference is the net interest spread. To qualify as a REIT and avoid corporate tax, it pays out substantially all of its taxable income as dividends.
That model wrecks every conventional metric:
- EV/FCF of 126x is meaningless. Free cash flow for a company whose entire “product” is buying and financing bonds tells you nothing. The service that computed this piece flagged dividends at 289% of the reported FCF figure. That’s not a red flag; it’s a signal that FCF is the wrong lens entirely.
- ROIC and operating margin are null because there’s no operating business in the traditional sense. There’s a balance sheet earning a spread.
- “Revenue” is net interest income, and it swings violently. It went from −$1.12B (2022) to $0.25B (2023) to $0.97B (2024) to $1.80B (2025) as interest rates moved. That’s not a growth story; it’s a rate-cycle story.
- The $70B of net “debt” is not a solvency problem. It’s repo funding against a bond portfolio, the raw material of the business, the way a bank’s deposits are. Judging it like an industrial company’s leverage would be wrong.
And crucially: there is no reverse-DCF here, and no growth hurdle. AGNC isn’t trying to compound cash flows for a decade. It’s trying to earn a spread and return it to you, quarter after quarter, without torching the principal. Applying a growth-based intrinsic-value model to it would produce a confident, precise, wrong number. (The finance service, dutifully running its default template, generated a “fair value” of $5.36 from one method and $111.80 from another. Both are nonsense for this business. I’m telling you that so you don’t trust a machine over the archetype.)
So we value it the way the market actually values mREITs: as a multiple of book value, with an eye on dividend coverage and book-value stability.
One substitution worth making explicit. My usual quality chart plots ROIC against the cost of capital, the fingerprint of a moat. That line doesn’t compute for an mREIT (ROIC is null, there’s no operating capital in the traditional sense). The REIT-appropriate version is return on equity against the cost of equity: does the levered spread engine earn more than shareholders demand for the risk? The cost-of-equity hurdle is about 10.1%, a CAPM figure built on AGNC’s beta of 1.298 and a 4.5% equity risk premium. That’s the closest thing to a “value creation” test here, and it’s every bit as volatile as the business.
And here’s the number the bull case would rather you didn’t average out. Take the four GAAP ROE years (−19.1%, 2.3%, 10.6%, 16.0%) and the through-the-cycle mean lands around 2.5%, well below that ~10.1% cost of equity. Across a full rate cycle, AGNC has not clearly earned its shareholders the return they require. The 2025 recovery clears the hurdle; the cycle does not.
Price-to-book: the master valuation metric
For a mortgage REIT, price-to-book (P/B) is the master gauge because the balance sheet is the business. AGNC holds a portfolio of government-guaranteed MBS marked close to market. Book value per share is, roughly, the liquidation value of that portfolio per share. So when you buy the stock, you’re really asking one question: how much of a premium (or discount) to that net asset value am I paying?
Right now, a premium. AGNC’s tangible net book value per share was $8.38 at March 31, 2026 (AGNC Q1 2026 results, reported April 20, 2026). Against the $11.12 price, that’s a price-to-tangible-book of about 1.33x. The 1.25x headline figure uses the prior quarter’s higher book value of $8.88 (December 31, 2025). Either way, you’re paying well above net asset value.
Is a premium warranted? Sometimes, yes. mREITs can trade above book when the market believes management can deploy fresh capital at attractive spreads, or when it trusts the dividend. Historically, agency mREITs have oscillated in roughly a 0.8x–1.1x book range, dipping to deep discounts in crises (when leverage terrifies investors) and pushing to premiums when spreads look juicy and the dividend feels safe. A sustained 1.25x–1.33x sits at the rich end of that band.
The dividend and its coverage: the reason anyone owns this
Nobody buys AGNC for capital appreciation. They buy it for the monthly check. AGNC pays $0.12 per share every month, $1.44 a year, a yield of roughly 13% at $11.12 (dividend declarations confirmed through June 2026). In a world where the risk-free rate sits well below that, a 13% yield is the entire pitch.
The trap is measuring that dividend against free cash flow (289% “payout,” meaningless) or even against GAAP earnings, which bounce around with mark-to-market swings. The right yardstick for an mREIT is net spread and dollar roll income, a non-GAAP measure of the recurring economic income the portfolio throws off, roughly the analog of distributable earnings.
On that measure, the dividend is currently covered. In Q1 2026, AGNC earned $0.42 per share of net spread and dollar roll income against a $0.36 quarterly dividend ($0.12 x 3). That’s about 1.17x coverage (Q1 2026 release). The annualized net interest spread for the quarter was 2.06%. So the operating engine is, for now, paying the dividend out of genuine spread income, not out of principal.
One honest caveat: I’m using net spread and dollar roll income as the coverage yardstick because that’s the metric AGNC reports and it maps to distributable earnings better than anything on the GAAP statements. If you want the precise “earnings available for distribution” figure quarter by quarter, that comes from the 10-Q reconciliation, and I’d point you there before drawing a hard line. The net-interest-income trend below is the longer-run proxy, and it’s flagged as such.
The real risk lives in book value, not the income statement
Here’s the part income-focused buyers routinely underweight: the dividend can be perfectly safe while you still lose money. How? Book value.
AGNC’s tangible book value per share fell 5.6% in a single quarter, from $8.88 to $8.38, in Q1 2026. Its economic return on tangible common equity for that quarter was negative 1.6%, meaning the dividend you collected was more than offset by the drop in the value of the portfolio. You got paid, and your net asset value shrank by more. That’s the whole trap of a high-yield mREIT: the yield is real, but so is the principal risk.
What drives that book-value volatility? Two things, amplified by leverage:
- Interest rates. When rates rise, the market value of the fixed-rate MBS portfolio falls. AGNC hedges a lot of this with swaps and Treasury shorts, but hedges are never perfect.
- MBS spreads. Even if Treasury yields are flat, the spread of mortgage rates over benchmark rates can widen (as it did in Q1 2026), which pushes MBS prices down independent of the underlying rate move. This is the risk that’s hardest to hedge, and it’s what bit AGNC last quarter.
Now layer on ~7.4x leverage. A small percentage move in a $95 billion portfolio becomes a large percentage move in $10 billion of equity. That’s the mechanism. It cuts both ways: when spreads tighten and rates cooperate, book value can jump (it rose 7.2% in Q4 2025). But you’re holding a levered bond fund, and it will behave like one.
The dividend: high yield, but a falling one
For an mREIT the dividend is not one line item among many, it’s the entire reason the stock exists. So it earns its own scoreboard. AGNC’s forward rate is $1.44 a year ($0.12 monthly), a trailing yield of 12.89% at $11.12. The payout ratio Yahoo reports, 112.5%, looks like AGNC is paying out more than it earns, and against GAAP earnings that’s roughly true in a soft quarter. But GAAP earnings for a levered bond book swing with mark-to-market noise. The honest coverage test, as I laid out above, is net spread and dollar roll income, which ran 1.17x in Q1 2026. Covered on the economic measure, “uncovered” on the accounting one. Both are true, and the gap is exactly why you can’t read an mREIT like a normal dividend payer.
Two things the yield-chasers miss. First, today’s 12.89% yield sits slightly below AGNC’s own five-year average of 13.7% (Yahoo Finance dividend data, as of July 8, 2026). On a pure yield-history basis the stock is not unusually cheap right now, it’s about average. Second, and more important: the dividend has been cut, repeatedly, over the past decade. The annual payout went from $2.48 in 2015 to $1.44 in 2025, a 5.3% annualized decline over ten years, and roughly flat (a slight -1.6% CAGR) over the last five. This is not a Dividend Aristocrat with a rising-payout streak. It’s a high-yield instrument whose per-share dividend has trended down as book value eroded and share count grew.
What management actually said
AGNC’s leadership, President and CEO Peter Federico and Executive Chairman Gary Kain, are agency-MBS specialists, and their Q1 2026 commentary is unusually candid about the two-sided nature of the quarter. Federico framed it plainly.
Peter Federico · President, CEO & Chief Investment Officer
Q1 2026 earnings release, April 20, 2026
"Agency MBS performance in the first quarter was driven by two divergent macroeconomic themes. In January and February, the Administration's focus on reducing interest rate volatility, maintaining mortgage spread stability, and improving housing affordability drove strong performance across the broader fixed income complex and Agency MBS specifically. This favorable investment environment was, however, quickly eclipsed in March by the war in Iran and the potential for more widespread conflict in the Middle East. The associated increase in volatility and negative shift in investor sentiment caused Agency MBS spreads to benchmark rates to widen, and, as a result, AGNC's economic return on tangible common equity in the first quarter was negative 1.6%."
That’s the honest version of the risk I described: management can execute well and still post a negative economic return when spreads widen on an exogenous shock. To their credit, Federico’s forward view leans on the same spread dynamic as a tailwind from here. He argued that mortgage spreads to benchmark rates had widened significantly in March and offered what he framed as attractive value on both an absolute and relative basis at those levels, and that supply-demand technicals have improved with higher mortgage rates, bond-fund inflows, and proposed regulatory capital changes. Wider spreads hurt book value on the way in, but they raise the return on newly deployed capital, which is why AGNC issued 38.0 million shares via its at-the-market program for $401 million net in Q1.
I want to be careful about the word “accretive” there, because it’s the claim mREIT bulls lean on hardest and it cuts both ways. Issuing 38 million shares grows the share count by roughly 3.7% (against a ~1.15 billion base), and the finance-service screen shows net stock issuance running at about 110% of “sales” for the trailing period. That is a lot of new equity. Selling stock above book value is mechanically accretive to book value per share in that instant, the new shares come in above the marked NAV, so existing holders’ per-share book ticks up. But it also enlarges the total dividend obligation (more shares, same $1.44 each), and it only compounds for you if the freshly raised capital earns its spread and book value doesn’t then slide on the same spread widening that made the raise look attractive. In a quarter where TBVPS fell 5.6%, the ATM math is a headline positive fighting a portfolio-mark negative. Read “accretive” as a conditional, not a given: per-share-real only if the spread holds and the marks cooperate.
So what’s it worth?
There’s no DCF fair value here, and I won’t manufacture one. For an mREIT, “fair value” is a judgment about the right multiple of book, cross-checked against where analysts and the dividend put it. Let me lay out the anchors honestly.
Intrinsic value · the verdict
Blended fair value
$11
Current price
$11
Margin of safety
3%
Fair values from multiple methods (see above). Source: AGNC Q1 2026 release; Yahoo Finance analyst consensus (8 analysts) · as of July 2026 · data as of 2026-07-08. Illustrative, assumption-driven, not a price target.
Read that as a mortgage-REIT valuation, not a growth valuation:
- Net asset value floor: roughly $8.38–$8.88 per share at 1.0x book. That’s what the portfolio is marked at. You’re paying $11.12, a 25%–33% premium.
- Analyst consensus: mean target $11.44, range $10.00–$12.50 across 8 analysts, with a “hold” rating (Yahoo Finance, as of July 8, 2026). Notice the target essentially sits at the current price. The Street sees AGNC as fairly valued: the premium to book is roughly the price of the ~13% yield and management’s track record.
- The dividend does the heavy lifting. At a ~13% yield with ~1.17x spread coverage, the market is willing to pay above book as long as the dividend holds and book value doesn’t erode faster than the coupon pays you.
There is no meaningful margin of safety to net asset value here, you’re paying up, and only a slim ~3% cushion to the analyst mean. This is not a “buy the assets at a discount” setup. It’s a “collect the yield and hope book value holds” setup, priced accordingly.
The one-sentence bet: can AGNC hold book value while the net interest spread keeps covering the dividend, given that rates (the Fed) and MBS spreads can move book value double digits in a quarter? If yes, the ~13% yield compounds and the premium is justified. If MBS spreads blow out or funding costs spike, you can collect the dividend and still lose money as book value falls, exactly what Q1 2026 showed in miniature.
Tailwinds and headwinds
Tailwinds:
- Wider MBS spreads mean fatter forward returns. The spread widening that hurt Q1 book value also raises the return on newly invested capital. Federico framed current spreads as attractive value on both an absolute and relative basis (Q1 2026 release).
- Improving supply-demand technicals. Management cited higher mortgage rates, increased bond-fund inflows, and proposed regulatory capital changes as supportive of Agency MBS.
- Capital raising that is accretive if the spread holds. Issuing equity above book (the $401M ATM raise in Q1, ~3.7% more shares) can grow the portfolio at attractive spreads and nudge book value per share up in the moment. But it also enlarges the total dividend obligation, and net issuance ran ~110% of “sales” this period; the compounding is per-share-real only when the new capital earns its spread and marks don’t slide. Treat it as a conditional tailwind, not a free one.
- Government guarantee. The portfolio is agency MBS, so credit risk is minimal. The risk is rate/spread, not default.
Headwinds:
- Book-value volatility is structural, not a bug. A −5.6% quarter can happen again on any spread-widening shock. The negative 1.6% economic return in Q1 2026 is the live example.
- Rate-path uncertainty. Federico himself flagged that “the path of future Federal Reserve monetary policy actions has become a bit more uncertain.” A hawkish surprise pressures both funding costs and book value.
- Geopolitical volatility. Management explicitly blamed the March spread widening on Middle East conflict escalation. Exogenous shocks hit spreads with no warning.
- Premium valuation caps upside. At 1.25x–1.33x book with an analyst target at the price, the stock isn’t cheap. Multiple compression back toward 1.0x book would sting even if the dividend holds.
- Dividend is not contractual. REIT payouts track distributable income. If the spread compresses meaningfully, the $0.12 monthly dividend is not guaranteed, AGNC has cut it before in tougher spread environments.
Next earnings land on July 20, 2026 (per company schedule). Watch three lines: tangible book value per share (did the Q1 slide continue or reverse?), net spread and dollar roll income versus the $0.36 dividend (is coverage holding above 1.0x?), and “at risk” leverage (did they add or de-risk?).
The number that should anchor your thinking
Forget the P/E. Forget the DCF. If you own AGNC or you’re eyeing that 13% yield, the figure to track every quarter is tangible book value per share against the price you paid. The dividend can be safe and the stock can still lose you money, that’s not a contradiction in a levered bond portfolio, it’s the defining feature. Q1 2026 paid you $0.36 and shaved $0.50 off book value. Whether the next few quarters flip that math is the entire investment.
What’s your read, is a ~13% yield worth paying 1.25x book when book value can drop 5% in a quarter? I’d genuinely like to hear how income investors weigh coverage against principal risk here. Find me on X or LinkedIn and let’s get into the mechanics.
Keep reading: if you want the contrast with a business you value on cash flows and returns on capital, see my breakdown of Microsoft as a quality-versus-price question, or browse the full Finance category for more archetype-by-archetype analysis.
Research note: financial figures are drawn from a local Yahoo Finance data snapshot (data as of July 8, 2026) and AGNC’s Q1 2026 earnings release (reported April 20, 2026, quarter ended March 31, 2026), cross-referenced with company dividend declarations through June 2026. Valuation inputs are computed from the financials and the mortgage-REIT archetype, not hand-picked; the standard EV/FCF, ROIC, and DCF outputs from the generic template are explicitly rejected here as inapplicable to an mREIT. Cross-check pivotal figures against AGNC’s 10-Q and 10-K filings on SEC EDGAR before relying on them. Analyst consensus reflects 8 analysts, mean target $11.44, as of July 8, 2026. Q1 2026 remains the latest reported quarter (Q2 2026 reports July 20, 2026); the management commentary quoted here is from the April 20, 2026 release and was not re-verifiable at this refresh, so no new call was incorporated.