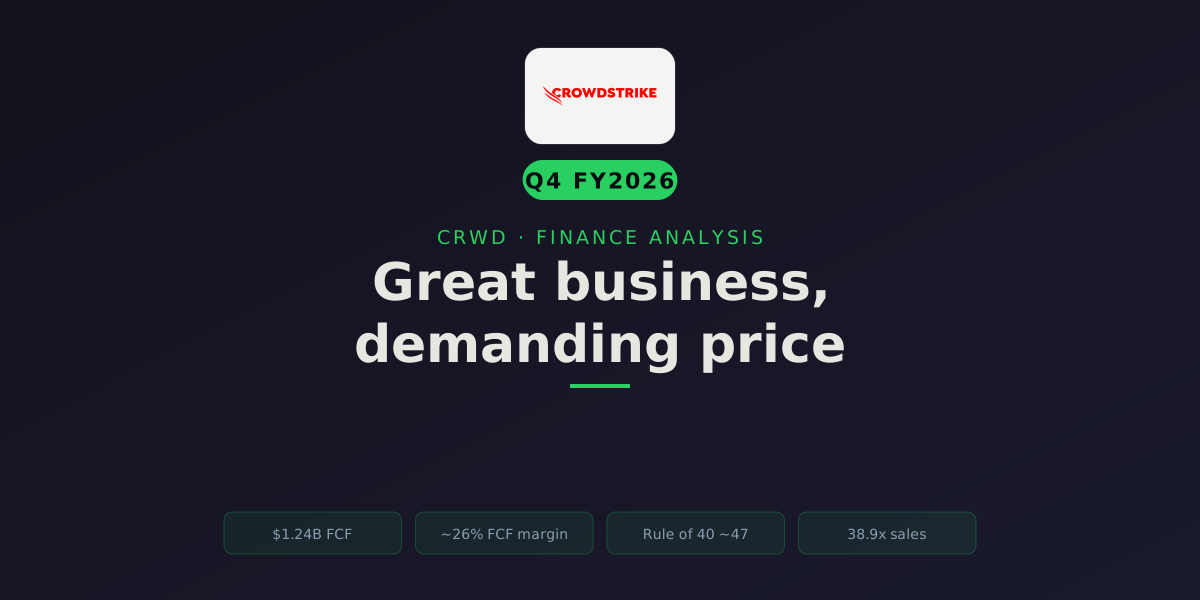
CrowdStrike lost money last year. On paper. The income statement shows a net loss of $163M for fiscal 2026 (the year ended January 31, 2026), and if you stop there you’d think the business is bleeding.
It generated $1.24 billion in free cash flow in the same year.
That gap, a GAAP loss sitting on top of more than a billion dollars of real cash, is the entire story of how you value a company like this. Get it wrong and you either dismiss a cash machine as unprofitable or you pay any price because “growth.” Both are mistakes. So let me walk through what CrowdStrike actually earns, why the accounting hides it, and what the current $194.62 price (as of July 8, 2026) is really asking you to believe.
One thing up front: the numbers below are computed from CrowdStrike’s own filings via the finance service, not hand-picked to fit a story. Where I lean less conservative, I say why. Where the price runs ahead of the math, I say that too.
Revenue grew from $2.24B (FY23) to $4.81B (FY26). Growth is decelerating in percentage terms (36% to 29% to 22%) but off a base that has more than doubled. For a company this size, holding above 20% after a major operational crisis (the July 2024 outage) is the real signal. The question is whether it stays there.
Free cash flow is operating cash flow minus capex. CrowdStrike converts roughly a quarter of every revenue dollar into spendable cash. That is elite for a company still investing hard to grow. This is the number to value, not GAAP earnings, because the subscription model collects cash up front while the accounting expense is spread out and loaded with non-cash stock comp.
The Rule of 40 says a healthy software business should have revenue growth plus profit margin above 40. CrowdStrike is at ~22% growth + ~26% FCF margin = ~47.5. It clears the bar comfortably, which is why the market treats it as a quality compounder rather than a growth-at-all-costs story. This is the metric that replaces ROIC for a scaling SaaS.
At 38.9x trailing sales (about 27x on next year's consensus revenue), CrowdStrike carries one of the richest multiples in large-cap software. The balance sheet is a fortress ($5.2B cash, net cash after debt), so there is no solvency risk. The risk is entirely in the multiple: the price already assumes years of near-flawless execution.
Why CrowdStrike’s P/E ratio is useless (and what to use instead)
Start by throwing out the price-to-earnings ratio. CrowdStrike doesn’t have a meaningful trailing P/E, because trailing GAAP earnings hover around zero and dip negative. The forward P/E of 124x is technically a number, but it’s built on thin projected earnings and tells you almost nothing.
Here’s why GAAP earnings are the wrong lens for this business. CrowdStrike sells subscriptions to its Falcon platform. Customers pay up front, so cash comes in the door fast. But the accounting spreads revenue recognition over the contract, front-loads sales and marketing to win the customer, and, crucially, expenses a mountain of stock-based compensation. In FY26 that stock comp was $1.10 billion, or 22.8% of revenue. It’s a real cost (it dilutes you as a shareholder), but it isn’t cash leaving the company. Subtract a billion dollars of non-cash expense from a business that’s roughly breakeven on cash operations and you get a GAAP loss on top of enormous cash generation.
So the metrics that matter for a scaling SaaS aren’t P/E and ROIC. They’re free cash flow and its margin, the Rule of 40, dollar-based net retention, and revenue multiples (EV/Sales, EV/FCF). GAAP return on invested capital reads negative here (roughly −5% to −9% over the last four years), but that number is close to meaningless: it’s dragged down by stock comp and by the fact that a young software company front-loads investment before the recurring revenue compounds. I’m not going to force a ROIC-versus-WACC “moat” chart onto a business where the accounting genuinely understates the economics. The moat shows up elsewhere: in the growth, the retention, and the cash conversion.
A GAAP loss on top of $1.24B in free cash flow isn’t a broken business. It’s an accounting artifact of subscriptions paid up front and a billion dollars of non-cash stock comp.
The growth-and-cash engine
CrowdStrike replaced return on capital with Rule of 40 in my read for a reason. At ~22% growth plus a ~26% FCF margin, it scores about 47.5, which comfortably clears the 40 threshold that separates durable software compounders from cash-burning growth stories. The five-year revenue CAGR is ~29%; the five-year FCF CAGR is ~23%. Both are decelerating, which is normal as the base gets bigger, but both are still strong.
The SBC gap: negative on paper, positive in cash
I want to be fair to both sides here. The bull says: ignore GAAP, the cash is real, and non-GAAP margins are strong and expanding. The bear says: stock comp is a real transfer of value from shareholders to employees, and adding it back every quarter flatters the picture. Both are right. The honest way to hold it is this: value the cash flow, but treat dilution as a permanent haircut to per-share value, and watch the stock-comp ratio like a hawk. At 22.8% of revenue, it’s high even for security software.
So put a number on the dilution rather than leaving “watch the SBC ratio” as a vibe. CrowdStrike issues roughly $1.10B of stock comp a year against ~1.02 billion diluted shares and a ~$198B market cap. If all of that flowed straight into new shares at the current price, that’s about 0.55% of the company handed to employees per year, roughly 5.6 million shares. In practice the gross share creation from equity awards runs higher than that (grants are struck below market and vest over time), so the true gross issuance is closer to the ~1% range annually before any offset. The company runs no buyback, so none of it is being mopped up. That is the baseline: absent repurchases, expect low-single-digit percent dilution a year to keep eating into per-share value, on top of whatever the operating business delivers. It’s survivable at 20%+ growth. It is not free.
The balance sheet is a fortress
Net-debt-to-EBITDA at −62.9x, current ratio 1.53, quick ratio 1.33. The red-flag screen raises exactly two items: ROIC below 10% in all four years (which, as I argued, is the wrong metric for this business) and stock comp at 22.8% of sales (which is the right thing to flag). No years of revenue decline, no negative free cash flow, no leverage problem. For a company with this growth profile, that’s a clean sheet with one honest asterisk on dilution.
Where the cash goes
The price: what $194 already assumes
Here’s where it gets uncomfortable for the bull case. CrowdStrike trades at 38.9x trailing sales, about 27x next year’s consensus revenue, and roughly 157x trailing free cash flow. These are growth-premium multiples in the top tier of software valuations. The right question isn’t “is that too high?” in the abstract. It’s “what growth does that price require, and is that growth realistic?”
The sharpest way to answer is a reverse discounted-cash-flow. Instead of guessing a fair value, you invert the problem: at today’s $194.62 and market cap of ~$198B, what free-cash-flow growth rate over the next decade justifies the price? The finance service computes it at roughly 35% per year, for ten years, before settling into a 3% terminal growth.
Sit with that number. CrowdStrike’s free cash flow grew at a ~23% CAGR over the last five years and last year’s FCF growth was ~16%. The price is asking for 35% annually, sustained for a decade. That’s not impossible for a category leader in a structurally growing market, but it’s a demanding bar, well above what the company has recently delivered, and it has to be cleared while the business is already approaching $5B in revenue and growth is decelerating.
What is CrowdStrike actually worth?
Let me build the range honestly, and show why the methods disagree.
The reverse-DCF is the hurdle. At $194.62 the market implies ~35% annual FCF growth for a decade. CrowdStrike has delivered ~23% (five-year FCF CAGR) and ~16% most recently. So the price sits above the company’s own track record. That’s the single most important sentence in this section: you are not being handed a margin of safety at today’s price, you are paying for acceleration.
The base-case DCF, and why it’s fragile. Using the data-derived assumptions, a recency-weighted growth trend of ~24% blended with analyst consensus, a CAPM-derived WACC of ~9.8%, and a 3% terminal growth, the illustrative DCF lands near $88 per share. Flex the growth rate by ±20% and the answer swings hard:
| Growth assumption | Illustrative fair value |
|---|---|
| ~19% (low) | ~$62 |
| ~24% (base) | ~$88 |
| ~29% (high) | ~$125 |
A few points of assumed growth move fair value by tens of dollars. Anyone quoting a single DCF number for a business like this is pretending to a precision that doesn’t exist. The DCF is a knife-edge, and its base case sits far below the market price, which tells you the market is discounting a growth path well above ~24%.
And before anyone objects that the discount rate is too harsh: it isn’t. The ~9.8% WACC comes off a beta of about 1.24, which is only modestly above the market. For a single-product, high-multiple software name that swung 60% off its 52-week low, a beta near 1.2 arguably understates the real volatility risk. If anything the WACC is generous. Push it higher toward a more punitive rate and the fair values in that table move lower, not higher. The gap to the market price is not an artifact of a stingy discount rate.
The multiple model, and its trap. The service’s multiple-based fair value comes to ~$109, but read it carefully: the P/E leg is garbage (negative earnings), the EV/EBITDA leg is distorted (tiny GAAP EBITDA), and the EV/FCF leg does most of the work. It’s directionally useful but built on a lumpy denominator. I wouldn’t anchor on it.
The messy middle. Reject both extremes. The pure DCF base case (~$88) is too pessimistic because it under-credits the durability and optionality of a category leader; the reverse-DCF hurdle (~35% growth) is too optimistic to underwrite with confidence. A blended intrinsic range somewhere around $95–$140 feels defensible depending on how much you credit the growth durability and the outage-proven stickiness. And notably, the analyst mean sits at $182.28, below today’s price.
Intrinsic value · the verdict
Blended fair value
$120
Current price
$195
Margin of safety
-38%
Reverse-DCF check: at $195 the market is implicitly pricing in roughly 35% annual free-cash-flow growth for the next decade. The question isn't whether the business is great. It's whether it can clear that bar.
Fair values from multiple methods (see above). Source: Yahoo Finance + computed WACC/growth · as of July 2026. Illustrative, assumption-driven, not a price target.
Two margins of safety, both negative today. Against my blended intrinsic range (~$95–$140, midpoint ~$120), the current price is roughly 30–40% above fair value. Against the analyst mean of $182.28, the price is ~6% above consensus. Whichever anchor you use, CrowdStrike is not trading at a discount right now. It’s priced for continued excellence, and then some.
A caveat the cash-conversion story needs: some of that FCF is a growth float. CrowdStrike’s free cash flow is flattered by working capital. In FY26 the change in working capital was a −$429M swing (the balance sheet carries about −$2.16B of working capital), and the bulk of that is deferred revenue: customers pay up front for multi-year subscriptions, so cash lands before the revenue is recognized. While billings grow fast, that deferred-revenue balance keeps expanding and throws off a recurring cash tailwind. It is real cash, but it is partly a function of the growth rate, not just the profitability.
Here’s the stress test. If billings growth halved, from roughly 20%+ toward the low teens, that deferred-revenue tailwind shrinks and FCF conversion would compress toward the underlying cash-operating margin. You can see the harsher version of that margin in the owner-earnings figure the finance service computes (EBITDA minus maintenance capex, interest, taxes, and the working-capital swing): it lands near ~$374M for FY26, versus the ~$1.24B headline FCF. That’s the floor the cash flow drifts toward if the growth float stops inflating. I don’t think it collapses that far, deferred revenue is sticky and multi-year, but the point stands: a chunk of the elite FCF margin is borrowed from the growth rate, and it partly unwinds if growth slows. The 26% margin is not a fixed property of the business; it’s the profitability plus a growth premium.
The one bet, and its single tripwire. Everything reduces to this: does CrowdStrike sustain 20%+ revenue growth and a ~26%+ FCF margin long enough to grow into a multiple that already prices in near-35% cash-flow compounding, with the July 2024 outage recovery as proof the platform is sticky enough to make it happen? Reduce it to one number you can check every quarter: dollar-based net retention. If it stays comfortably above ~110% (and gross retention holds), the growth-and-float engine keeps turning and the thesis is intact. If DBNR slips below ~110% or gross retention starts leaking, both the growth and the deferred-revenue cash tailwind fade at once, and the multiple has a long way to fall. That’s the falsifiable core. Not the price target, the retention number.
Tailwinds and headwinds
A note on sourcing before the forward read: I was unable to reliably access CrowdStrike’s most recent earnings call transcript and press releases at the time of writing (the fetch tooling was down). So I’m keeping this section to structural drivers and publicly documented facts, and I’m deliberately not citing specific ARR, net-new-ARR, dollar-based net retention, or forward-guidance figures I couldn’t verify word-for-word. Where I’d normally quote CEO George Kurtz directly, I’m leaving the quote out rather than paraphrasing something into quotation marks. Confirm the latest quarterly metrics against CrowdStrike’s investor-relations releases and the 10-K/10-Q on SEC EDGAR before acting on anything here. The next earnings date is around September 1, 2026.
Tailwinds.
- Structural demand for security. Cyber spend is one of the most resilient IT budget lines. Endpoint, cloud, identity, and next-gen SIEM are all expanding markets, and CrowdStrike plays across all of them from a single agent. That breadth is what powers the land-and-expand model: sell one module, upsell the rest. This is the mechanism that has to keep the ~20%+ growth alive.
- The single-agent platform and data network effect. Falcon runs as one lightweight sensor feeding a shared cloud, so every new endpoint improves the threat detection for everyone. That’s a genuine network effect and the closest thing CrowdStrike has to a durable moat. It’s also why switching costs are high once a customer standardizes on the platform.
- The outage recovery as proof of stickiness. The most bullish datapoint isn’t a metric, it’s the counterfactual that didn’t happen. After a self-inflicted global outage in July 2024, revenue kept growing through FY25 and FY26 and free cash flow set records. Customers had every reason to leave and mostly didn’t. That validates the switching-cost thesis better than any marketing slide.
Headwinds.
- The valuation itself is the biggest risk. At 38x sales and a price above the analyst mean, there’s no cushion. If growth decelerates toward the mid-teens, the multiple compresses and the stock can fall sharply even if the business is fine. High-multiple software is unforgiving on any growth disappointment.
- Stock-based comp dilution. At 22.8% of revenue, SBC is quietly transferring a fifth of the value the business creates to employees, and there are no buybacks yet to offset it. This is a real, ongoing drag on per-share value.
- Competition on all fronts. Microsoft bundles security into its enterprise agreements (a pricing threat that’s hard to beat), SentinelOne competes directly on endpoint, and Palo Alto Networks is consolidating the broader platform market. CrowdStrike’s module-attach engine has to keep winning against deep-pocketed rivals.
- Lingering outage overhang. The July 2024 incident held customers, but legal and remediation costs are still flowing through the numbers, and reputational risk in a security vendor is asymmetric: you’re only as trusted as your last update.
Great business, demanding price
The business is genuinely excellent. A leading security platform, a real network-effect moat, $1.24B of free cash flow at a ~26% margin, a fortress balance sheet, and a Rule of 40 near 47. The July 2024 outage was the ultimate stress test of customer loyalty, and the platform passed. If you were building a checklist for a quality SaaS compounder, CrowdStrike ticks nearly every box.
The price is the problem. At $194.62 the market is asking for ~35% annual free-cash-flow growth for a decade from a company that has recently grown FCF in the teens-to-twenties, and the stock trades above where the analyst consensus sits. That’s not a reason it can’t go higher, momentum and category leadership can carry a name well past any DCF for a long time. It’s a reason to be clear-eyed that at this price you’re underwriting acceleration, not paying for a margin of safety.
What would change my read? If dollar-based net retention re-accelerates and stock comp starts trending down as a share of revenue, the “grow into the multiple” case strengthens materially. If growth slips toward the mid-teens or the module-attach engine stalls against Microsoft’s bundling, the multiple has a long way to fall. Watch the retention number and the SBC ratio. Those two, more than the headline growth rate, will settle whether this price was visionary or just expensive.
What’s your take? Is CrowdStrike’s outage recovery proof of a moat wide enough to justify 38x sales, or is the market pricing in growth that decelerating revenue can’t deliver? I’d genuinely like to hear the bear case. Find me on X and LinkedIn.
Keep reading: For a contrast in how the market prices a very different kind of quality, see my breakdown of Visa’s payment-network moat, a capital-light compounder where the reverse-DCF hurdle sits below the track record, the mirror image of CrowdStrike. Or explore the full Finance category for more valuation deep-dives.
Research note: Financial data is sourced from Yahoo Finance, computed from CrowdStrike’s filings via a local analysis service, as of July 8, 2026. Valuation inputs (WACC ~9.8%, growth ~24%, reverse-DCF implied growth ~35%) are derived from the financials, not hand-picked, and are illustrative rather than price targets. The most recent earnings-call metrics (ARR, net-new-ARR, dollar-based net retention, forward guidance) could not be verified at the time of writing due to a fetch-tooling outage and were deliberately omitted rather than estimated; confirm them against CrowdStrike’s investor-relations releases and the 10-K/10-Q on SEC EDGAR. All figures should be cross-checked against primary filings before use.